

Appearance
Google Analytics integration
Google Analytics (GA4) is Google's analytics service for websites and apps. This integration lets your WeWeb backend run reports over any date range, see the activity of the last 30 minutes, list the dimensions and metrics a property offers, and show a report in a table.
It only retrieves data: it never changes anything in Google Analytics. That makes it a good fit for dashboards inside your app.
Use cases
- Build an analytics dashboard in your app: monthly traffic, top pages, traffic sources, conversions.
- Show a "users on the site right now" widget with the realtime report.
- Feed charts and Data Grids from a GA4 report, through a table.
- Compare this month to last month by running the same report over two date ranges.
- Filter a report to one country, campaign or section of your site before showing it.
Setup
Google Analytics authenticates with a service account: a robot Google identity that belongs to your Google Cloud project. You create it once, download its JSON key, and give it access to your GA4 property the same way you would invite a person.
Sign in to Google Cloud Console.
Create a project or select an existing one.
Enable the Google Analytics Data API and the Google Analytics Admin API (the Data API runs the reports, the Admin API lists your properties in WeWeb).
Go to
IAM & Admin→Service Accountsand clickCreate service account.Name the service account and click
Create and continue.Skip role assignment and click
Done.Open the service account menu (three dots) →
Manage keys→Add key→Create new key→JSON, then download the key file.Copy the service account email from the
Detailstab.In Google Analytics, open
Admin→Property access management, add the service account email with theViewerrole, uncheckNotify new users by email(a service account has no inbox), and clickAdd.In WeWeb, open
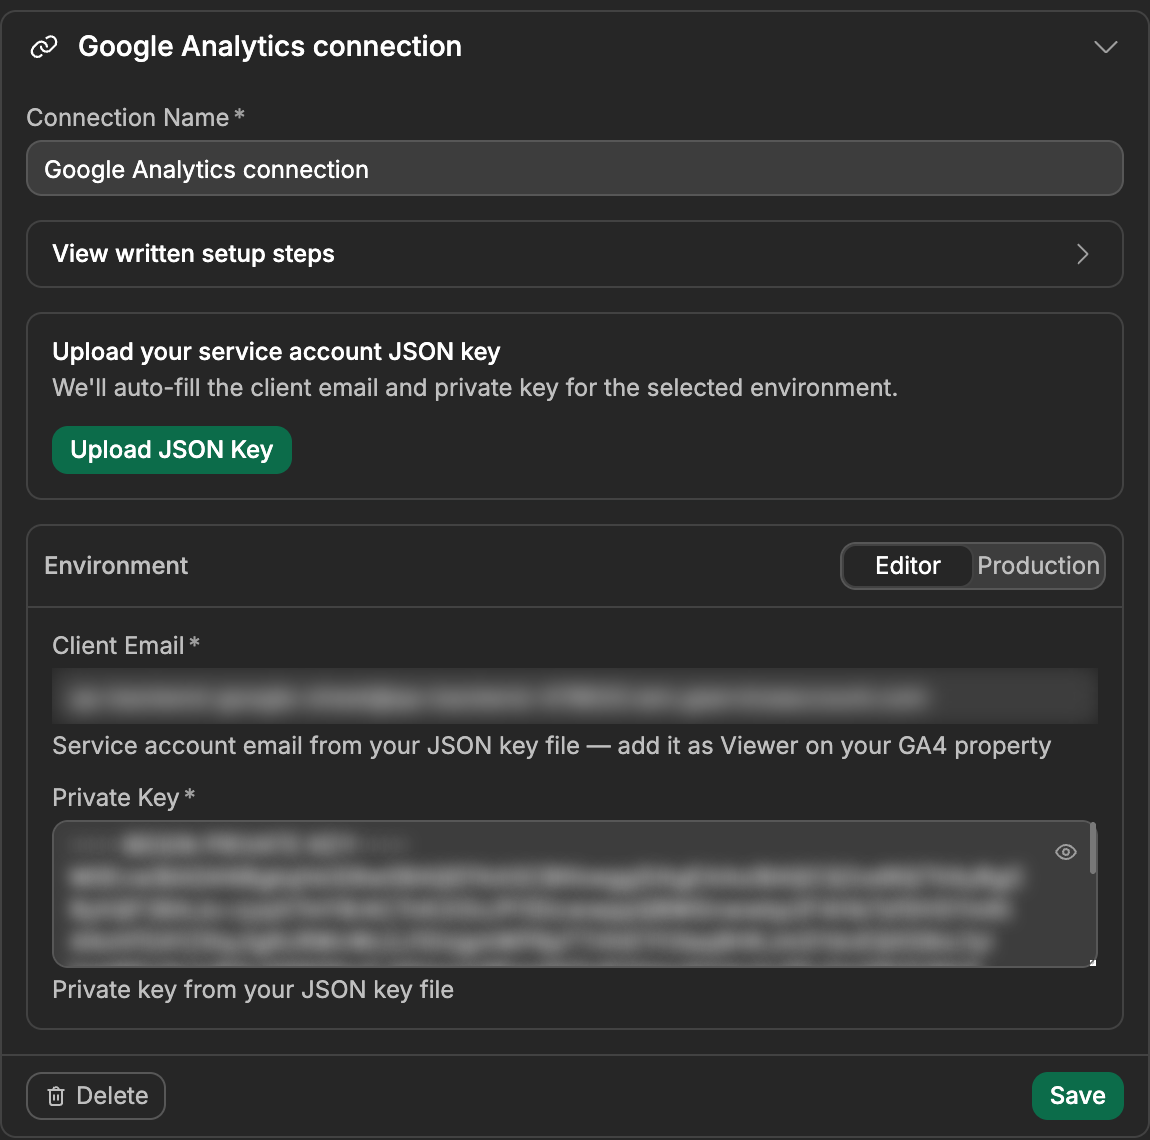
Data & API→Integrations, selectGoogle Analytics, and clickAdd Connection.Add your credentials for each environment you use (
Editor,Staging,Production):Client Email— From the JSON key (client_email)Private Key— From the JSON key (private_key)
You can also upload the JSON key file in the connection screen to auto-fill these fields.
Stagingonly appears if your plan includes it.Test in WeWeb by running the
Run Reportaction: pick your property inProperty, keep the default dates, and add one metric such asSessions.
NO REGISTRATION STEP
Unlike Google Calendar, there is nothing to register in the connection. The Viewer access is all it takes: the property appears in the Property dropdown of every action and in the table setup right away.
How GA4 reports work
A few GA4 concepts shape every action on this page.
Property ID, not measurement ID
Every action takes the numeric ID of your GA4 property, such as 506356075. The Property dropdown fills it in for you, and it lists every property where the service account has Viewer access.
The G-XXXXXXX code from your site's tracking snippet is a measurement ID, which is something else. WeWeb refuses it and tells you where to find the property ID: in GA4, Admin → Property → Property details.
Dimensions and metrics
A report counts metrics (numbers, like Sessions or Active users) and splits them by dimensions (descriptions, like Country, Date or Page path). A report takes up to 9 dimensions and 10 metrics. With no dimension, you get a single row with the totals.
The Dimensions and Metrics dropdowns list what the selected property offers, including your custom ones. In workflows and results, each field uses its technical name, such as activeUsers for Active users. The Get Metadata action returns the full list with both names.
Some dimensions and metrics can't be used together, and the report then fails with a 400 error. Run Check Compatibility with the same fields to see which one is the problem.
The property can't be bound in every action
In Run Report, Check Compatibility and the table setup, the property fills the Dimensions and Metrics dropdowns, so you pick it from the list and can't bind it. Get Metadata and Run Realtime Report accept a bound property ID. If one workflow must work with several properties, add one report action per property.
Date ranges
Start Date and End Date accept a date (2026-09-01), a number of days ago (28daysAgo), yesterday or today. By default, a report covers 28daysAgo to yesterday, both days included.
Three things to plan for:
- GA4 takes 24 to 48 hours to process data (part of today's data appears after 2 to 6 hours), so
todayis always incomplete. Preferyesterdayas the end date. - A range that ends before it starts is refused, and the error names both dates. The common case:
Start Dateset totodaywhileEnd Dateis still on its defaultyesterday. SetEnd Datetotodayas well. - Each report covers one date range. To compare two periods, run the report twice (see the FAQs).
Some rows can be hidden
When a report includes demographic dimensions (age, gender, interests), Google hides the rows with very few users to protect their privacy. There is no error and no warning: the rows are just missing, and the totals are lower. Remove the demographic dimensions to get the full numbers back.
Realtime reports
Run Realtime Report shows the activity of the last minutes (up to 30), a few seconds after it happens. It has its own short list of dimensions and metrics, listed in Run Realtime Report: regular report fields like sessions or date don't work there. A realtime report returns no rows when nobody is on your site, which is normal.
Because the data appears within seconds, a realtime report is also the quickest way to check a new setup: open your site in another tab and run it.
What a report returns
Each row is a simple object, with one key per dimension and metric. Metrics are already numbers, so you can use them in charts and formulas directly. Dates stay text, such as 20260901.
json
{ "country": "France", "sessions": 4889 }rowCount is the total number of rows that match the report, not the number of rows returned. To go through a big report, raise Offset by the number of rows you received, and stop once you have rowCount rows.
Limits
Google limits how many reports each property can run per hour and per day. Each Run Report result includes propertyQuota, which shows what you used and what is left. If a report fails, don't run it again and again: after 10 server errors in an hour, Google blocks the property until the next hour. See Google's quota documentation.
Filtering reports
Simple filters
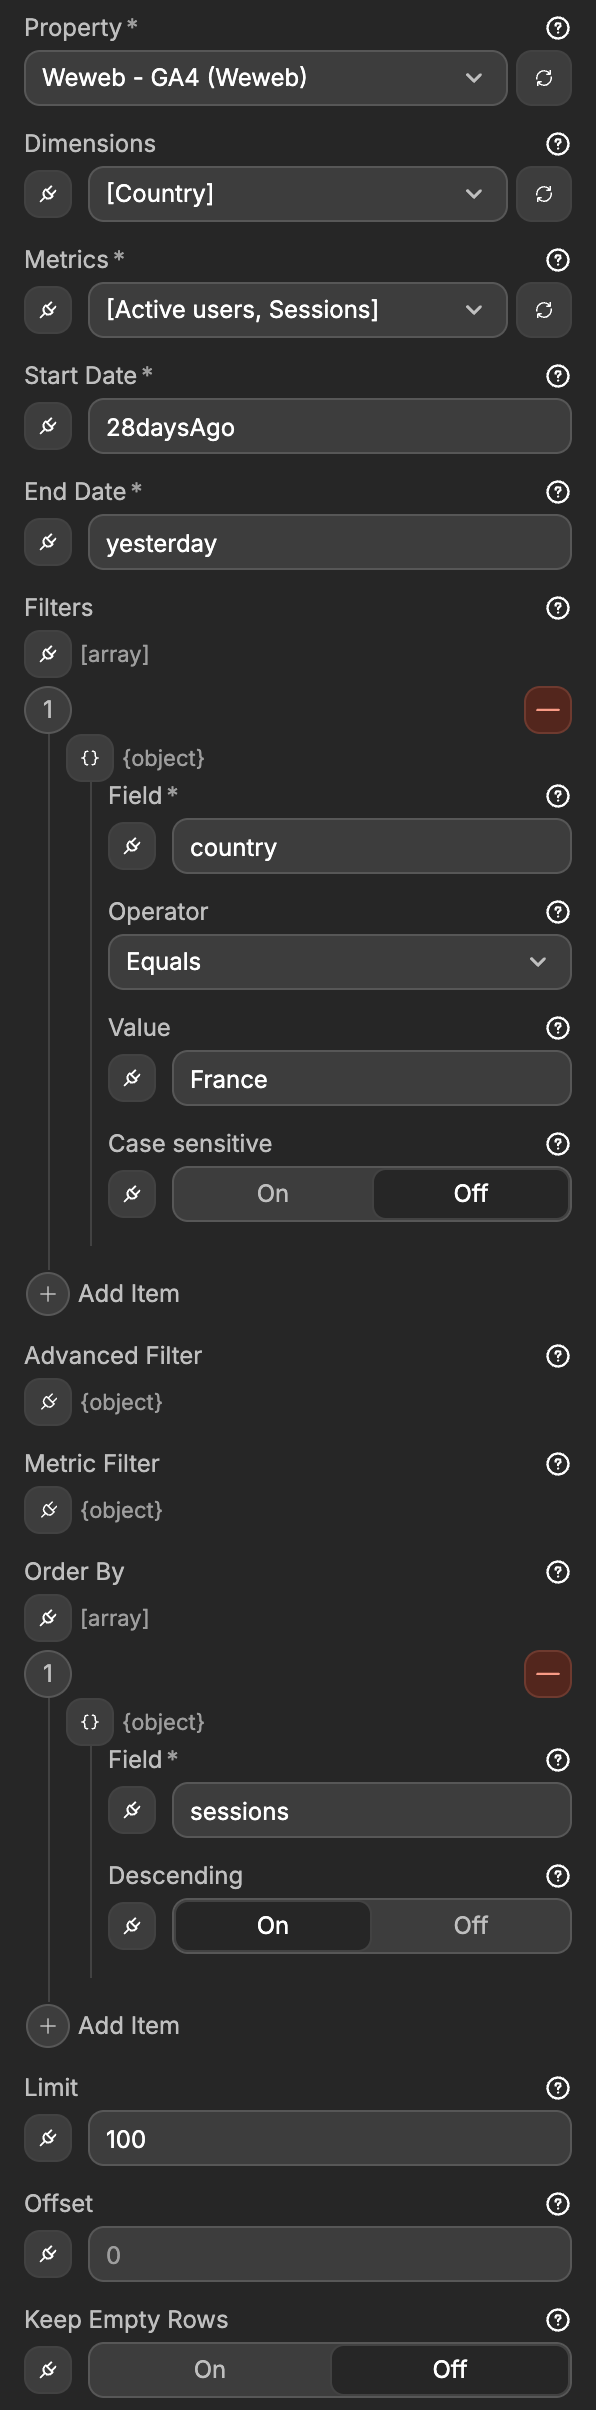
Use Filters to keep only the rows you want. Each filter has a Field (one of the report's dimensions), an Operator and a Value. When you add several filters, rows must match all of them.
Text matches ignore upper and lower case by default: country Equals france returns France. Turn on Case sensitive to match the case exactly.
Advanced filters
For filters that Filters can't express, like "France or Germany" or "not France", use Advanced Filter. It takes a filter written in Google's format (FilterExpression) and replaces Filters when it is set. For example, France or Germany:
json
{ "orGroup": { "expressions": [
  { "filter": { "fieldName": "country", "stringFilter": { "value": "France" } } },
  { "filter": { "fieldName": "country", "stringFilter": { "value": "Germany" } } }
] } }
To filter on a metric, such as "more than 100 sessions", use Metric Filter. It uses the same format and applies to the totals, once the rows are grouped:
json
{ "filter": { "fieldName": "sessions", "numericFilter": { "operation": "GREATER_THAN", "value": { "int64Value": "100" } } } }Using Google Analytics as a data source for tables
Besides calling Google Analytics actions from workflows, you can use Google Analytics as a data source for tables in WeWeb. A table linked to Google Analytics is a saved GA4 report: you choose the property, metrics, dimensions and dates once. That table can be bound to table components (e.g. Data Grid, charts) or fetched from the interface with the Table View: Fetch action.
Add a Google Analytics table
- In WeWeb, go to the
Data & APItab, then open theTablessubtab →Add Table. - Choose Google Analytics as the data source.
- Select your Google Analytics connection.
- Set up the report: select the
Propertyand at least one metric inMetrics. You can also pickDimensionsand changeStart DateandEnd Date(same formats and defaults asRun Report). - Save. The table is now available in your project.
Rows come with one column per dimension and metric, and metrics are numbers.
Configure a view
Views define which rows of the report the table returns, and in which order. On the Google Analytics table you added:
- Create or edit a view for that table.
- Open
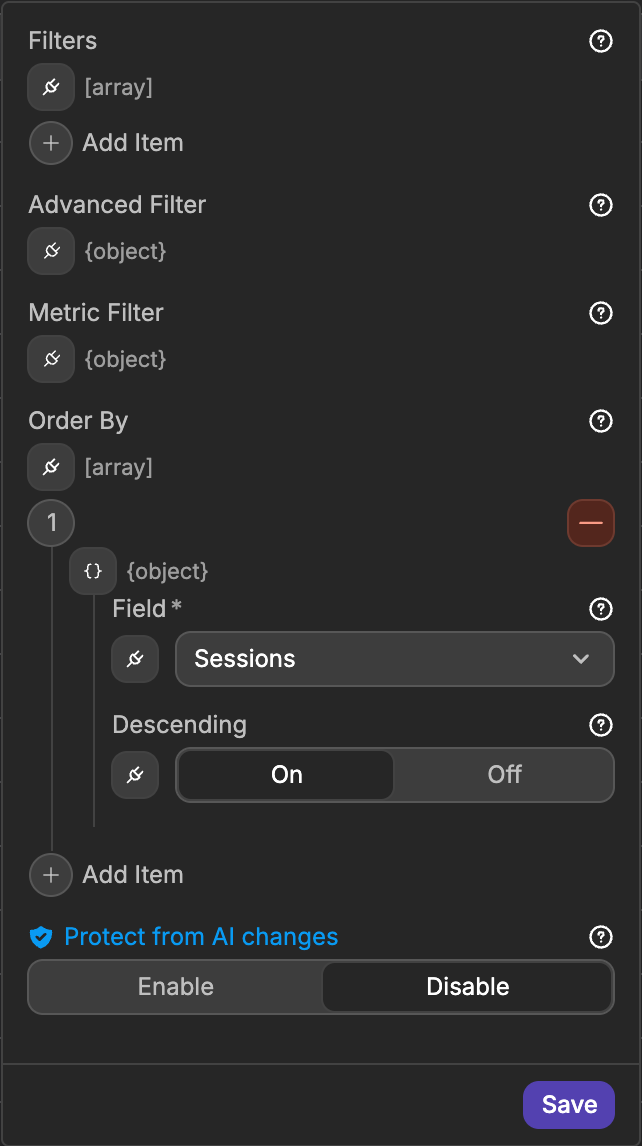
Configurationand set any of these optional fields:- Filters — The same simple filters as
Run Report.Fieldis a dropdown of the table's dimensions. - Advanced Filter and Metric Filter — The same advanced filters as
Run Report. - Order By — Sort rows by one of the table's dimensions or metrics, with
Descendingon or off.
- Filters — The same simple filters as
The view loads 100 rows at a time by default, up to 10,000 (a higher value is lowered to 10,000). WeWeb knows the total number of rows, so the standard paginator works and users can jump to any page.
Use the table in the interface
- Bind a view — In the binding menu, under Table Views, select the view. Bind it to a Data Grid, repeating group, or list.
- Table View: Fetch — In an interface workflow, add the
Table View: Fetchaction, choose your Google Analytics table view, and pass any parameters the view expects.
For the general pattern of tables, views, and fetching data, see Working with data and Table View: Fetch.
Common pitfalls (setup & usage)
The Property dropdown is empty
The service account has no access yet. In GA4, add the service account email (the Client Email of the connection) with the Viewer role in Admin → Property access management, then click the refresh icon next to Property. Also check that the Google Analytics Admin API is enabled in the Google Cloud project: it fills this dropdown.
The live app gets a 403 error but the editor works
The Property dropdown and the dimension and metric lists always use the Editor key. If Production uses another service account, the editor works but the live app doesn't. Give that service account Viewer access too, or use the same JSON key in every environment.
"G-XXXXXXX" is refused
That's the measurement ID from your site's tracking snippet, not the property ID. Pick the property in the Property dropdown, or find its numeric ID in GA4 under Admin → Property → Property details.
A report returns no rows
Usually not a bug. GA4 takes 24 to 48 hours to process data, so a new property or a very recent range has nothing yet, and a relative range like 7daysAgo misses data that is older. Check the setup with Run Realtime Report, then widen the range with exact dates. Rows where every metric is zero are also left out unless Keep Empty Rows is on.
The numbers are lower than in Google Analytics
Reports with demographic dimensions hide rows with very few users, and recent days are still incomplete. Remove the demographic dimensions and end the range at yesterday.
A filter fails with "not among the selected dimensions"
A simple filter can only use a dimension that is in the report's Dimensions. Add the field to Dimensions, or use Metric Filter to filter on a metric.
Run Report fails with a 400 error on a report that looks right
Some dimensions and metrics can't be used together. Run Check Compatibility with the same property, dimensions and metrics: it marks each one COMPATIBLE or INCOMPATIBLE.
My page gets "Internal Server Error" instead of the real error
When a Google Analytics action fails inside an API endpoint, the endpoint answers with a generic 500 Internal Server Error, and your page never sees the reason. To send the real message to your page:
- Add a
Try/Catchto the endpoint and put the Google Analytics action in theTrybranch. - In the
Catchbranch, add aSend Response. - Bind its data to the error message of the
Try/Catch(caughtError.message), and its status code to Google's own code (caughtError.cause.code), with400as a fallback for errors that WeWeb catches itself.
All Actions
Four actions: two reports and two helpers to explore a property. Each action name links to its details below.
| Action | Description |
|---|---|
| Run Report | Count metrics over a date range, split by dimensions, with filters, sorting and pagination. |
| Run Realtime Report | See the activity of the last minutes, up to 30. |
| Get Metadata | List every dimension and metric a property offers, including custom ones. |
| Check Compatibility | Check whether dimensions and metrics can be used together in one report. |
Action details
Run Report
Count metrics over a date range, split by dimensions, with optional filters, sorting and pagination.
Inputs
| Display Key | Example Input | Description | Restrictions |
|---|---|---|---|
Property | 506356075 | GA4 property to report on. Lists the properties where the service account has Viewer access. | Required. Can't be bound. Not the G-… measurement ID |
Metrics | ["sessions","activeUsers"] | Numbers to count. The dropdown lists the property's metrics. | Required. Up to 10 |
Start Date | 28daysAgo | First day of the report. | Required. A date (YYYY-MM-DD), NdaysAgo, yesterday or today. Default 28daysAgo |
End Date | yesterday | Last day of the report, included. Prefer yesterday: today's data is incomplete. | Required. Same formats as Start Date. Default yesterday. Can't be before Start Date |
DimensionsOptional | ["country"] | How to split the numbers. Empty gives a single row with the totals. | Up to 9 |
FiltersOptional | [{"field":"country","operator":"equals","value":"France"}] | Keep only the rows that match all these filters. Ignored when Advanced Filter is set. | See structure below |
Advanced FilterOptional | {"orGroup":{"expressions":[…]}} | Filter written in Google's format, for cases Filters can't express. See Advanced filters. | Replaces Filters when set |
Metric FilterOptional | {"filter":{"fieldName":"sessions",…}} | Filter on metrics, applied to the totals. See Advanced filters. | Metrics only |
Order ByOptional | [{"field":"sessions","desc":true}] | How to sort the rows. Empty keeps Google's order. | See structure below |
LimitOptional | 100 | Maximum number of rows to return. | Whole number of at least 1. Default 10000, max 250000 |
OffsetOptional | 0 | Row to start from, for pagination. 0 is the first row. | Whole number of at least 0 |
Keep Empty RowsOptional | false | Also return rows where every metric is zero, such as days with no visits. | Default false |
Filters structure
| Field | Example input | Description | Restrictions |
|---|---|---|---|
Field | country | Technical name of the dimension to filter on. | Required. Must be one of the report's Dimensions |
Operator | equals | How to compare. | Valid: Equals (equals, default), Contains (contains), Begins with (begins with), Ends with (ends with), Regexp (full match) (regexp full), Regexp (partial match) (regexp partial), In list (comma-separated) (in list), Is empty (is empty), = (numeric) (=), > (numeric) (>), >= (numeric) (>=), < (numeric) (<), <= (numeric) (<=) |
Value | France | Value to compare with. For In list, separate values with commas (France,Germany). | Required, and a number, for the numeric operators. Leave empty for Is empty |
Case sensitiveOptional | false | Match upper and lower case exactly. | Default off. Only for the text operators and In list |
Order By structure
| Field | Example input | Description | Restrictions |
|---|---|---|---|
Field | sessions | Technical name of one of the report's metrics or dimensions. | Required |
Descending | true | Sort from highest to lowest. | Default false |
Example output
json
{
  "rows": [
    { "country": "France", "sessions": 4889 },
    { "country": "Germany", "sessions": 3828 }
  ],
  "rowCount": 2,
  "propertyQuota": {
    "tokensPerDay": { "consumed": 1, "remaining": 24999 },
    "tokensPerHour": { "consumed": 1, "remaining": 4999 },
    "concurrentRequests": { "consumed": 0, "remaining": 10 },
    "serverErrorsPerProjectPerHour": { "consumed": 0, "remaining": 10 },
    "potentiallyThresholdedRequestsPerHour": { "consumed": 0, "remaining": 120 }
  }
}
rowCount is the total number of matching rows. A totals list is also included when Google returns one. A report with no data returns rows: [].
Documentation of API endpoint that powers action: Google Analytics Data API – runReport (POST /v1beta/properties/{property}:runReport)
Run Realtime Report
See the activity of the last minutes, up to 30, with the realtime dimensions and metrics.
Inputs
| Display Key | Example Input | Description | Restrictions |
|---|---|---|---|
Property | 506356075 | GA4 property to report on. | Required. Can be bound. Not the G-… measurement ID |
Metrics | ["activeUsers"] | Numbers to count. | Required. Valid: Active users (activeUsers), Event count (eventCount), Key events (keyEvents), Views (screenPageViews) |
DimensionsOptional | ["country"] | How to split the numbers. Custom user dimensions (customUser:…) also work when bound. | Valid: App version, Audience ID, Audience name, Audience resource name, City, City ID, Country, Country ID, Device category, Event name, Realtime minutes ago, Platform, Stream ID, Stream name, Page title and screen name |
LimitOptional | 100 | Maximum number of rows to return. | Whole number of at least 1 |
Lookback WindowOptional | 30 | How many minutes to look back. Empty covers the last 30 minutes. | Valid: Last 5 minutes to Last 30 minutes, in steps of 5. A bound value is a whole number from 1 to 30 |
Example output
json
{
  "rows": [
    { "country": "France", "activeUsers": 3 },
    { "country": "Germany", "activeUsers": 1 }
  ],
  "rowCount": 2
}
With Realtime minutes ago in Dimensions, a window of N minutes returns one row per minute, from 0 (this minute) to N−1. See Google's realtime reference for what each field means.
Documentation of API endpoint that powers action: Google Analytics Data API – runRealtimeReport (POST /v1beta/properties/{property}:runRealtimeReport)
Get Metadata
List every dimension and metric a property offers, with its technical name, its name in Google Analytics and a description, including custom fields.
Inputs
| Display Key | Example Input | Description | Restrictions |
|---|---|---|---|
Property | 506356075 | GA4 property to list the fields of. | Required. Can be bound. Not the G-… measurement ID |
Example output
json
{
  "dimensions": [
    { "apiName": "date", "uiName": "Date", "description": "The date of the event, formatted as YYYYMMDD.", "category": "Time" },
    { "apiName": "customEvent:plan_type", "uiName": "plan_type", "description": "…", "category": "Custom", "customDefinition": true }
  ],
  "metrics": [
    { "apiName": "sessions", "uiName": "Sessions", "description": "The number of sessions that began on your site or app.", "category": "Session" }
  ]
}
apiName is the technical name to use in reports. customDefinition only appears, set to true, on custom fields.
Documentation of API endpoint that powers action: Google Analytics Data API – getMetadata (GET /v1beta/properties/{property}/metadata)
Check Compatibility
Check whether dimensions and metrics can be used together in one report, before Run Report fails with a 400 error.
The answer has two lists. Each list only covers the fields you entered in it, and a list you leave empty comes back with every field of the property. So, to see which dimensions you can still add to your metrics, fill Metrics only. With both empty, you get every field of the property (375 or more).
Inputs
| Display Key | Example Input | Description | Restrictions |
|---|---|---|---|
Property | 506356075 | GA4 property to check against. | Required. Can't be bound. Not the G-… measurement ID |
DimensionsOptional | ["country"] | Dimensions to check. Empty returns the answer for every dimension. | Up to 9 |
MetricsOptional | ["sessions","purchaserRate"] | Metrics to check. Empty returns the answer for every metric. | Up to 10 |
Example output
json
{
  "dimensionCompatibilities": [
    { "dimensionMetadata": { "apiName": "country", "uiName": "Country" }, "compatibility": "COMPATIBLE" }
  ],
  "metricCompatibilities": [
    { "metricMetadata": { "apiName": "sessions", "uiName": "Sessions" }, "compatibility": "COMPATIBLE" },
    { "metricMetadata": { "apiName": "purchaserRate", "uiName": "Purchaser rate" }, "compatibility": "INCOMPATIBLE" }
  ]
}
Documentation of API endpoint that powers action: Google Analytics Data API – checkCompatibility (POST /v1beta/properties/{property}:checkCompatibility)
Error handling
Errors come from two places, and they read differently:
- WeWeb checks some values before calling Google, and explains what to fix when one is wrong: a missing
Client EmailorPrivate Key, a missing property, aG-…measurement ID, a date range that ends before it starts, aLimit,OffsetorLookback Windowthat isn't a whole number, a filter with noField, a filter on a dimension that isn't in the report, an unknown operator, a numeric operator with an empty or non-numeric value, anOrder Byfield that isn't in the report, or a table with no property or no metric. - Errors from Google stop the workflow, and the workflow logs show Google's own message. Inside an API endpoint, the caller only gets
500 Internal Server Errorunless you return the error yourself (see the pitfall above). In the editor, when the property list is empty, WeWeb reminds you to add the service account asViewer.
| Error code and type | Reason |
|---|---|
| 400 Bad Request | Dimensions and metrics that can't be used together (run Check Compatibility), an unknown field name, a date in the wrong format, or an invalid Advanced Filter or Metric Filter. |
| 401 Unauthorized | Invalid or malformed service account credentials (Client Email / Private Key mismatch). |
| 403 Forbidden | The Data API or the Admin API isn't enabled in the Google Cloud project, or the service account has no Viewer access on the property. |
| 429 Too Many Requests | The property used up its hourly or daily limit. Check propertyQuota in the last Run Report result, run reports less often, and retry later. |
| 500 Internal Server Error | Google-side error. Retry later, without repeating the call in a loop: 10 server errors in an hour block the property until the next hour. |
FAQs
Why are my numbers lower than in Google Analytics?
Two usual reasons. Reports with demographic dimensions (age, gender, interests) hide rows with very few users, so remove those dimensions to get the full numbers. And GA4 takes 24 to 48 hours to process data, so recent days are incomplete: end the range at yesterday rather than today.
Why does my report return no rows?
Usually the processing delay or the date range. A new property has no processed data for the first day or two, and a relative range like 7daysAgo misses older data. Check the setup with Run Realtime Report, then widen the range with exact dates. Rows where every metric is zero are also left out unless Keep Empty Rows is on.
How do I compare this month to last month?
Each report covers one date range, so add two Run Report actions to the same workflow, with the same Dimensions and Metrics: one with this month's dates, one with last month's. Then compute the difference or the percentage change in a formula or in the next action.
Where do I find my property ID?
The Property dropdown fills it in for you. To find it yourself, open GA4 → Admin → Property → Property details. It's a number like 506356075. The G-… code from your tracking snippet is the measurement ID, which WeWeb refuses.
Why can't I bind the property in Run Report?
In Run Report, Check Compatibility and the table setup, the property fills the Dimensions and Metrics dropdowns, so you pick it from the list. Get Metadata and Run Realtime Report accept a bound property. For several properties, add one report action per property.
How do I keep only the rows with more than 100 sessions?
Simple Filters only work on dimensions. Use Metric Filter: {"filter":{"fieldName":"sessions","numericFilter":{"operation":"GREATER_THAN","value":{"int64Value":"100"}}}}. See Advanced filters.
Why does Run Realtime Report return no rows?
Nobody was on your site in the last minutes. Open your site in another tab and run the action again. Also check that you use the realtime fields: regular report fields like sessions or date don't work there.
How do I get all the rows of a big report?
Each call returns at most Limit rows (10,000 by default, 250,000 at most), and rowCount gives the total. Run the report again with Offset raised by the number of rows you received, until you have rowCount rows. In a table, the standard paginator does this for you.
CONTINUE LEARNING
Reports work best in a table, bound to a chart or a Data Grid. See how tables, views and fetching data fit together.