

Appearance
Views
Views let you create reusable “saved lists” of records from a table, with filters, sorting, grouping, and optional parameters (dynamic inputs).
They’re useful when you want to show different parts of the same table (for example “My orders”, “Pending approvals”, “Last 30 days”) without rebuilding the logic each time.
Example use cases
- Admin review queue: restrict by role and filter for a specific status (e.g., pending)
- My items (per user): securely retrieve data belonging to the user signed in
- Recent activity: get all records that were created in the last 30 days, sorted by the most recent first
Creating a view
Views are created on top of a table.
To create a view:
- Go to the
Data & APItab, then open theTablessubtab. - Select the table you want to create a view for.
- At the top of the table, click
New view. - (Optional) Rename the view by clicking its name.
WeWeb will create your new view and open it so you can start setting up Filters, Sort, and Parameters.
To rename a view, change its description, or adjust how its data behaves when users move between pages, open the view settings menu from the ⋮ button on the view tab.
CREATING TABLES
Having a table is a prerequisite to creating views. If you are unsure what a table is or how to create one, you can learn more in the tables documentation→
Configuring a view
Once you have created a view, you are able to customise exactly how that view is filtered and sorted.
Filters
To configure filters, click Filter above the table to open the filter modal:
From here, you can add one or more rules:
- Choose the column you want to filter on.
- Choose the condition (for example “Is”, “Contains”, “Is after”, “Is empty”).
- Choose the value for the rule.
- You can type a fixed value, or bind it to a view
Parameterto make it dynamic.
- You can type a fixed value, or bind it to a view
DYNAMIC FILTERS
The ability to make filters dynamic is what makes them truly powerful.
To make a filter dynamic, you need to utilize Parameters
You also are able to apply more advanced filters, such as
Combining multiple conditions with And/Or logic
Example:
status is activeAndcreatedAt is after 1 Nov 2025Grouping related rules with
Add condition groupExample: Group “Text search” with
name Contains searchOrdescription Contains search, then at the root addAnd status is activeNesting groups (e.g., an
Andgroup inside anOrgroup) for complex logicExample:
(status is active And (type is Pro Or type is Enterprise))Toggling a filter to only be applied if there is a valid value
Example: Bind the value to the
searchparameter and set the rule to “apply only if value exists”; whensearchis empty the rule is skipped
Date and time filters
If your table has date or date/time columns, the filter modal includes conditions designed for dates (for example “Is before”, “Is after”, “Is between”, and relative options like “Last 7 days” when available).
Use these for “Recent activity” style views.
Filtering using relationships (linked tables)
If your table has relationship columns (linked rows), you can filter based on fields inside the linked table.
For example, in an Orders view you might filter on the linked Customer record’s email.
Typical flow:
- In the filter modal, choose the relationship column (for example
Customer). - Choose a field from the linked table (for example
email). - Pick a condition and value (for example “Contains” →
@weweb.io).
If your filter UI shows a scope selector, you can also “enter” a relationship scope first, then add filters inside that linked table scope.
Sorting
To configure sorting, click the Sort button above the table to open the sort modal:
From here, you can define how rows should be ordered by:
- Selecting the column you want to sort by
- Choose the order with the direction control (
AscorDesc)
You can then apply however many additional sorts you like by pressing Add sort:
Grouping records
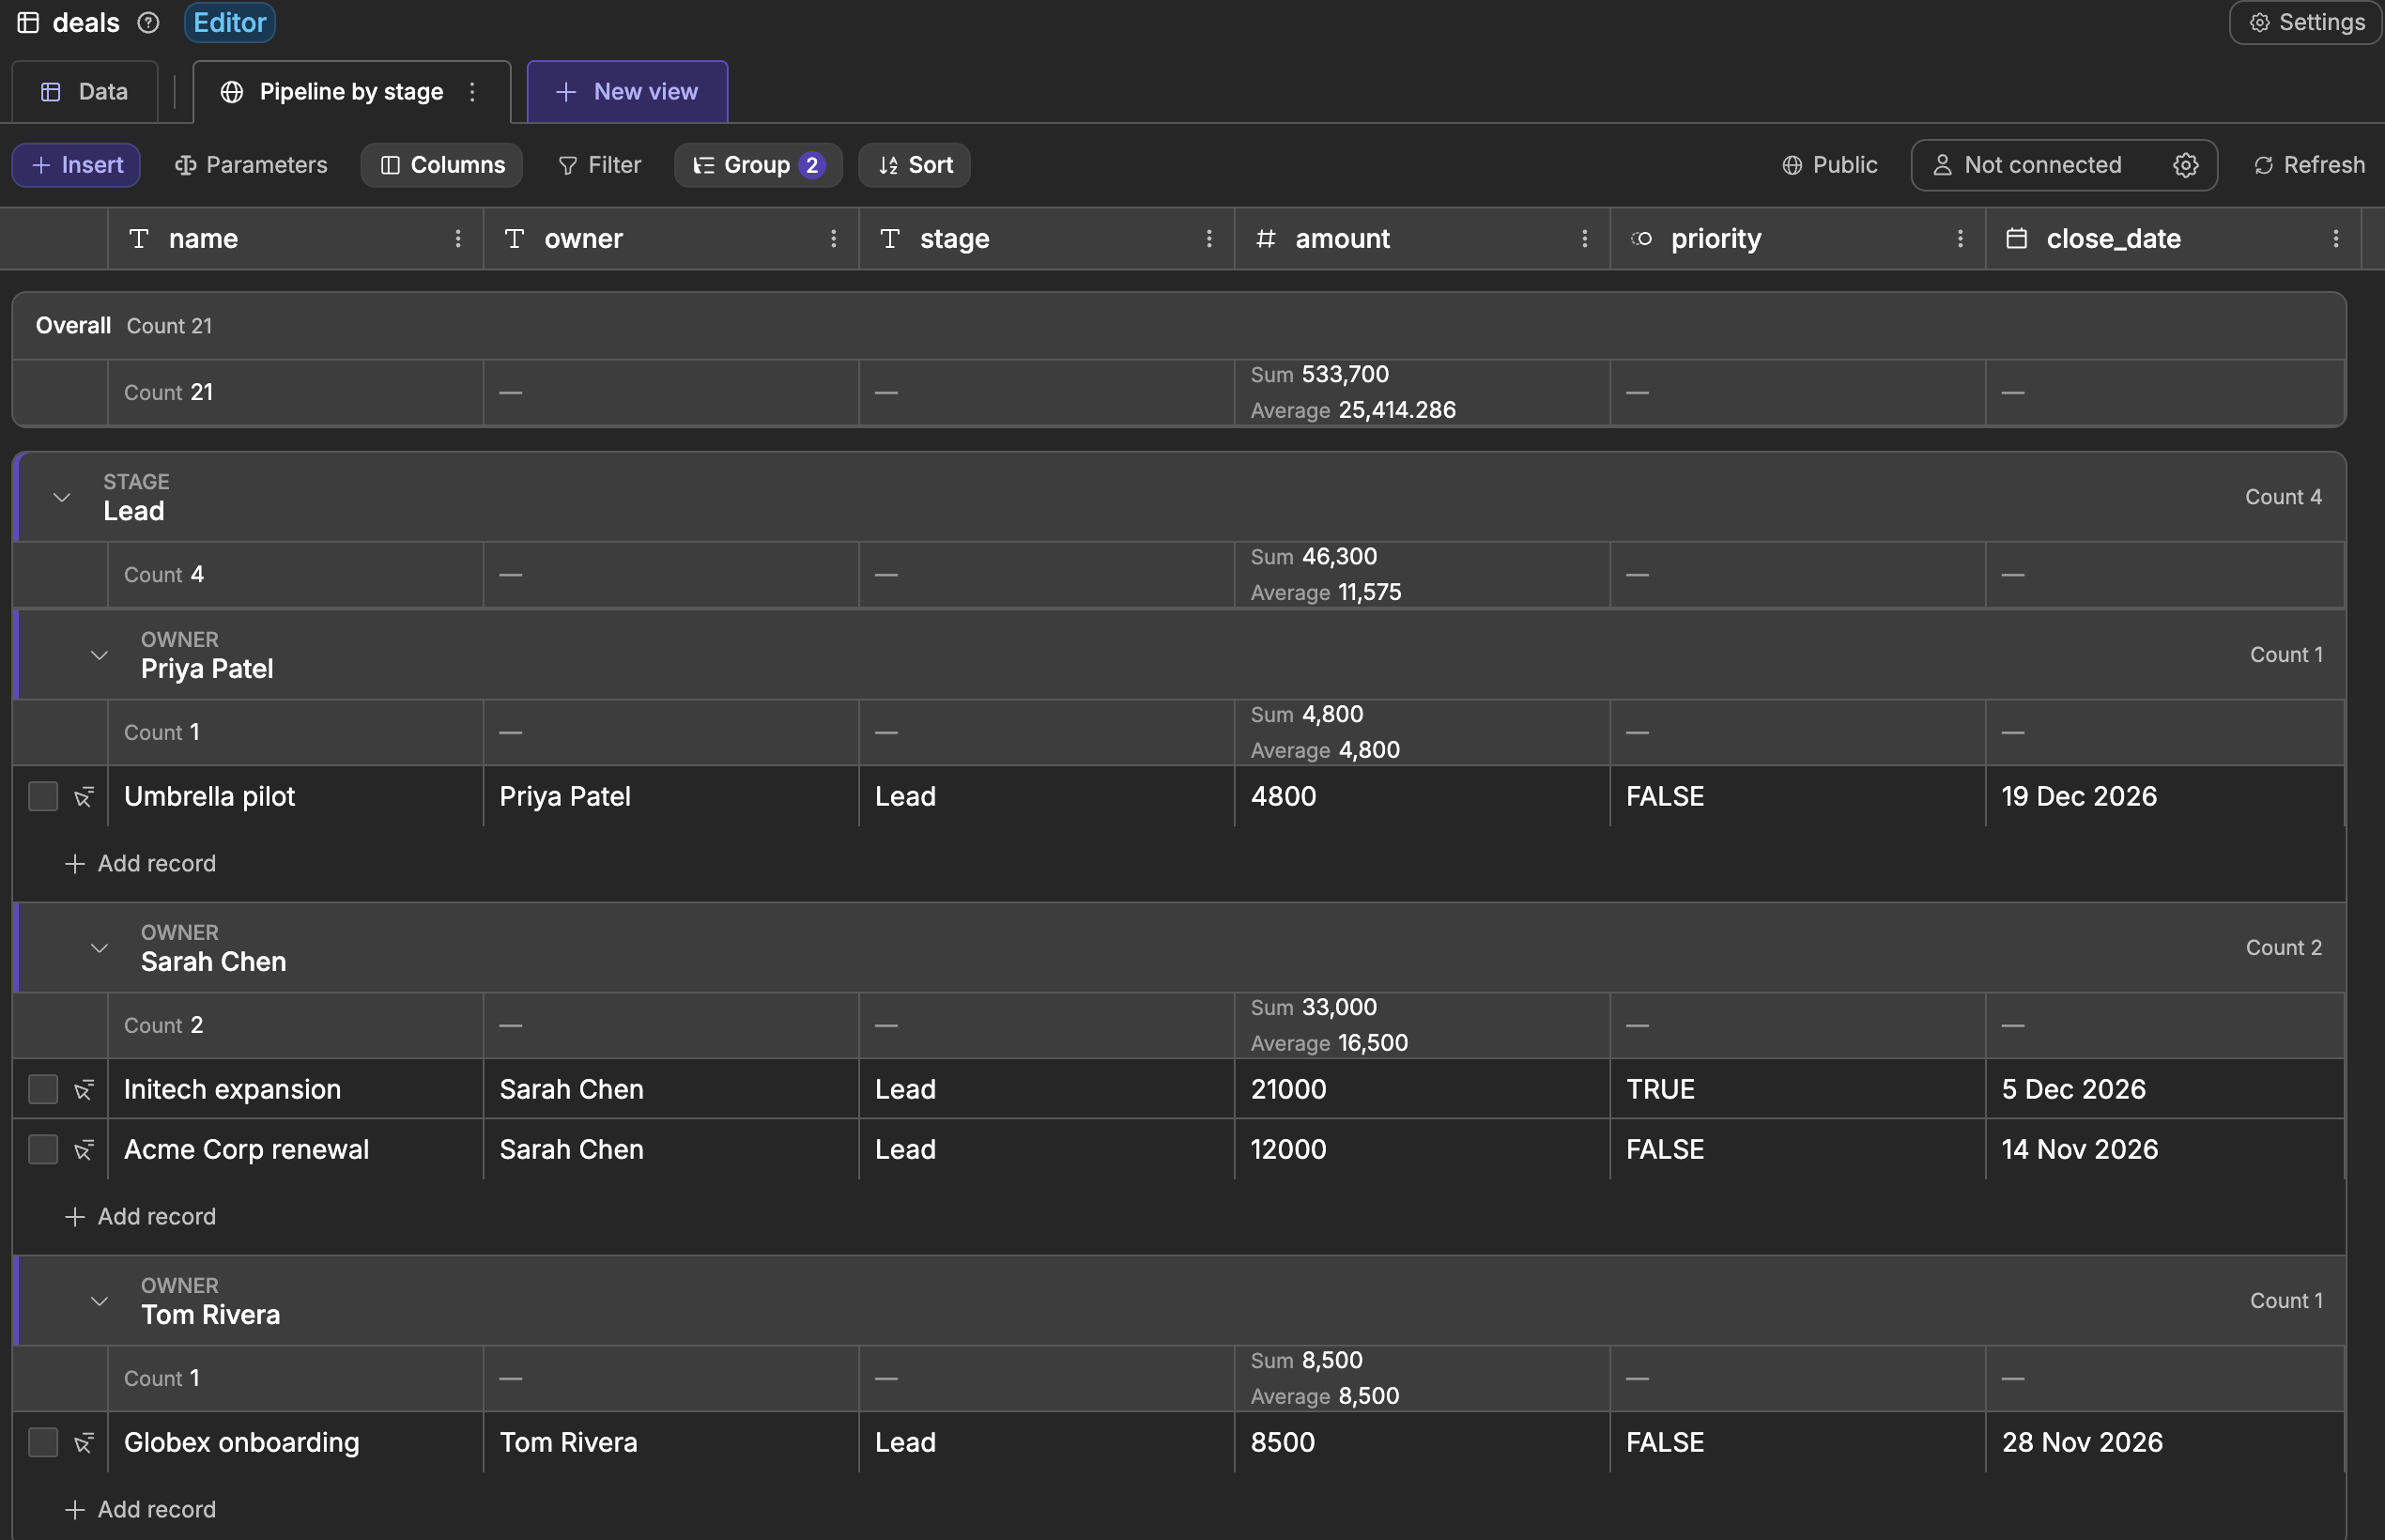
Grouping sorts the records of a view into sections that you can open and close, like folders. For example, you can group deals by stage, invoices by month, or tasks by the person they are assigned to.
Grouping only changes how the view shows its records. It does not create, copy, or delete anything in your table.
Add a group
- Click
Groupabove the table. - Pick the column you want to group by.
- Choose the order of the groups:
Ascending(A to Z, oldest to newest) orDescending(Z to A, newest to oldest).
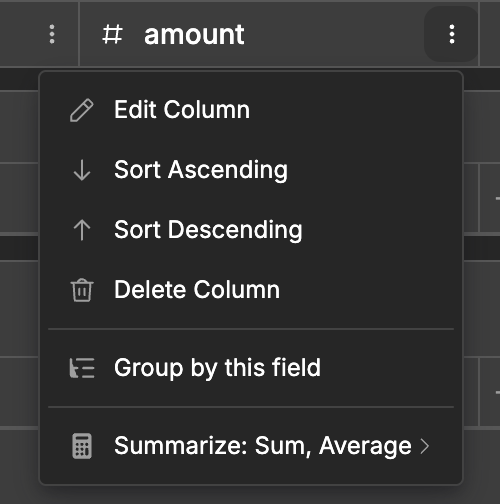
You can also open the ⋮ menu of a column header and select Group by this field.
The order you choose in the grouping panel only sorts the groups themselves. To sort the records inside each group, use Sort as usual.
Add subgroups
Click Add subgroup to split each group by another column. A view can have up to three levels.
For example, grouping by stage and then by owner creates one section per stage, with one section per sales rep inside it. The records sit inside the last level.
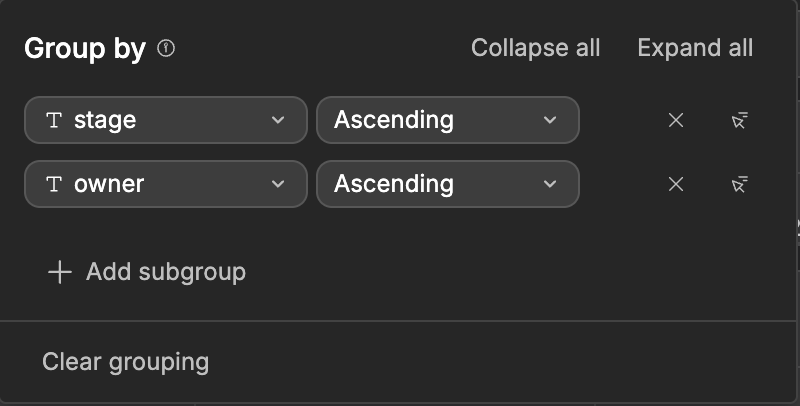
In the grouping panel, you can:
- Drag a rule by its handle to change the order of the levels.
- Remove a level with
×. - Use
Collapse allorExpand allto close or open every group in the table. - Click
Clear groupingto go back to a plain list.
Group dates and numbers
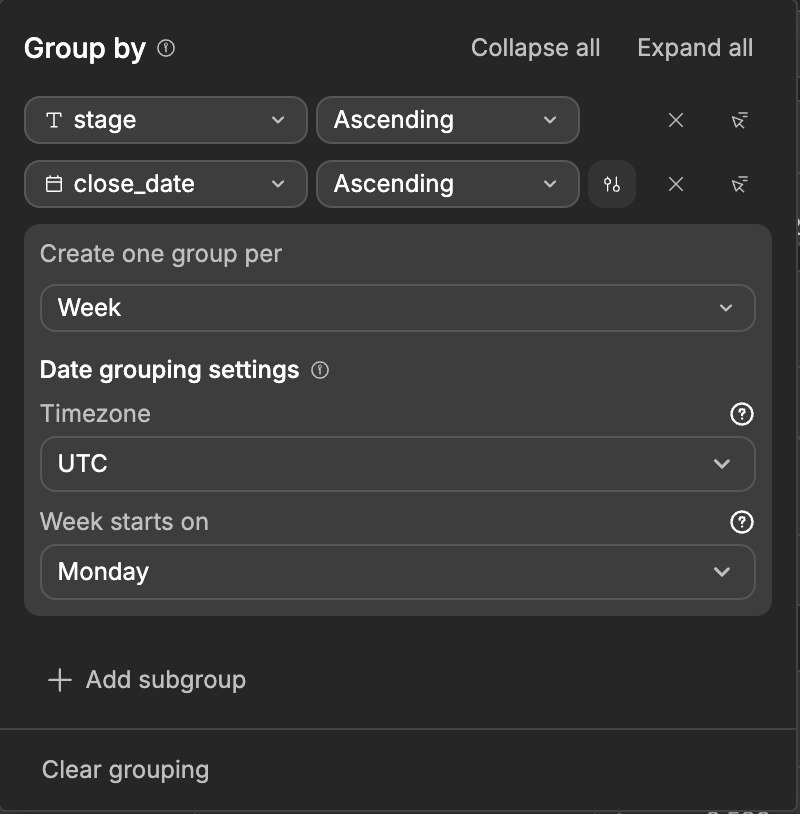
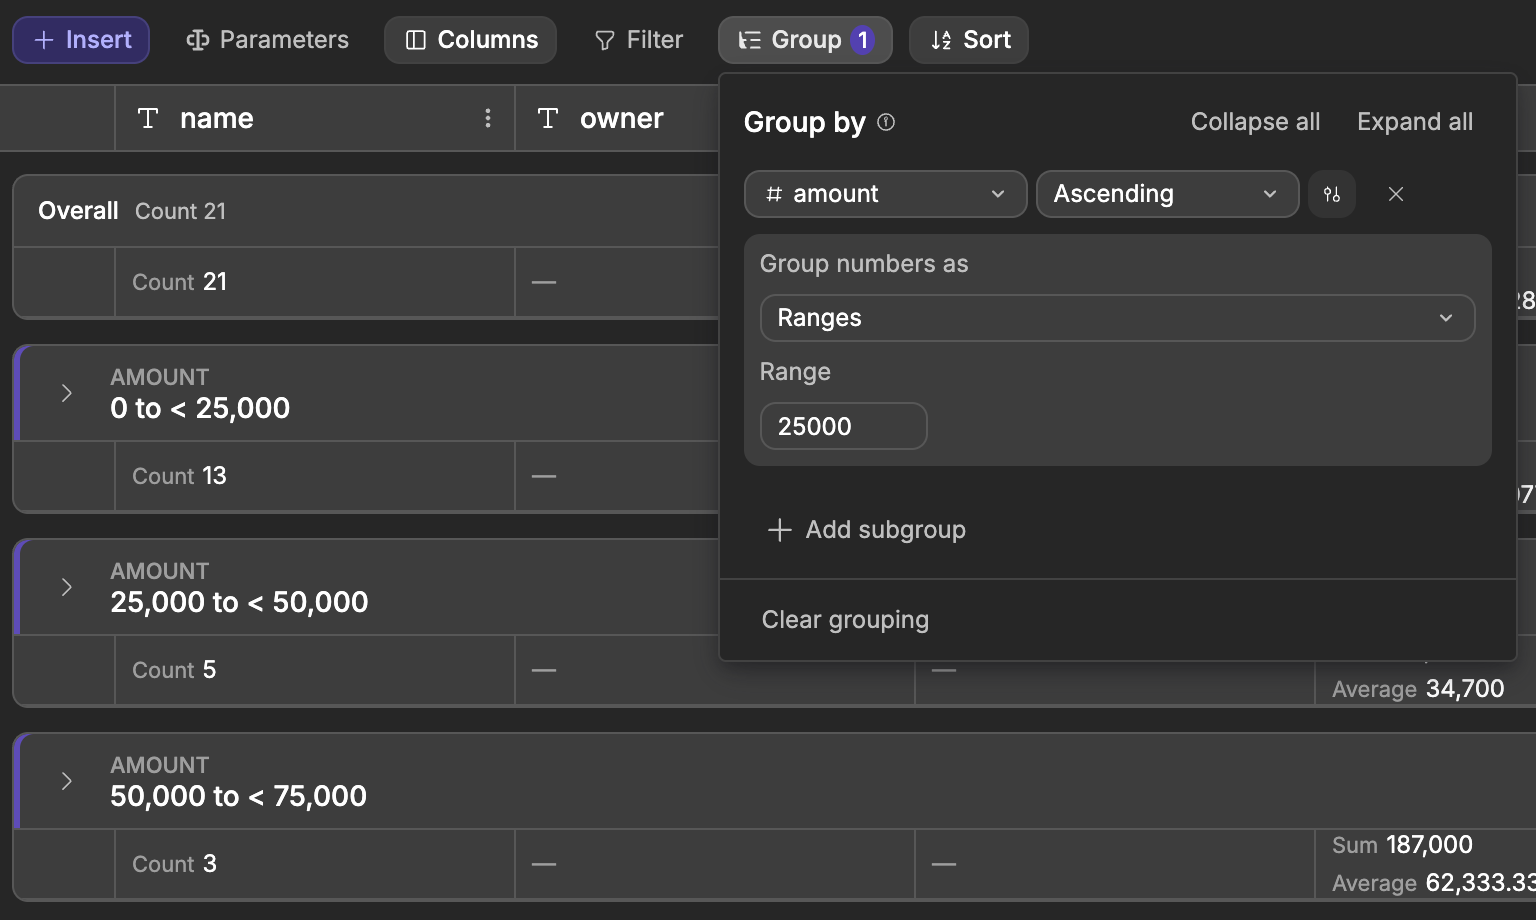
Date and number columns have extra options. To open them, click the settings icon (two small sliders) between the order and ×. The icon only appears on date and number columns. Hover it to see Choose date grouping intervals or Choose number ranges.
For dates, choose how big each group should be in Create one group per: Exact date and time, Day, Week, Month, Quarter, or Year. When you pick a date column, WeWeb groups it by Month to start with.
As soon as a date is grouped by period, Date grouping settings appear in the same box:
- Time zone in
Timezone, set toUTCby default. Pick another one from the list, such asEurope/ParisorAmerica/New_York. - First day of the week in
Week starts on, set toMondayby default. It only appears when you group byWeek.
The time zone decides which day, month or year a record falls into. A deal closed at 12:30 AM on April 1 in Paris is still March 31 in UTC, so it lands in March with UTC and in April with Europe/Paris. These settings are saved with the view and apply to everyone who sees it, in the editor and in your published app.
For numbers, choose Exact values to create one group per value, or Ranges to create groups of the same size. With a range of 25000, deals are grouped as 0 to < 25,000, 25,000 to < 50,000, and so on.
Text and empty values
Text groups use the exact value, including uppercase letters and spaces. Paris, paris and Paris (with a space at the end) make three different groups.
Records with no value in the grouping column end up in a group called Empty. Text columns can also contain an empty text, which is not the same as no value: those records get their own group, Empty text.
Move records between groups
You can drag a record onto another group to change its value. For example, dragging a deal from Lead to Qualified updates its stage column to Qualified.
This only works when WeWeb can write the new value directly in the column. It is not available when the group is a period of dates (such as a month), a number range, or the result of a formula column.
When moving records is available, Add record at the bottom of each group of the last level creates a new record with the group's values already filled in.
Which columns can be grouped
- Grouping is available for views of WeWeb tables.
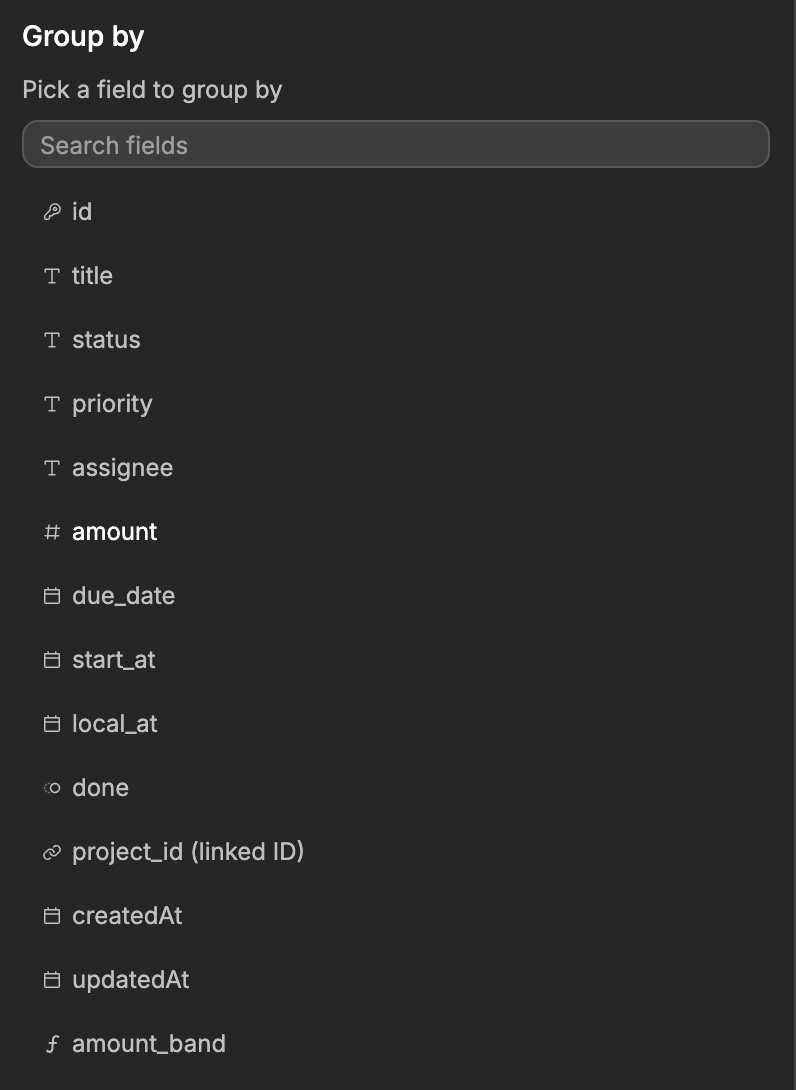
- You can group by text, number, yes/no (boolean), date, ID, and user columns, and by formula columns that return one of these types.
- Lists, JSON columns, and fields of a linked table cannot be used for grouping.
- A column that links to one record of another table appears as
<column name> (linked ID). It groups records by the ID of the linked record, not by its name. - A view cannot be grouped while it is sorted by a field of a linked table. Remove that sort first.
- To group records in an API Endpoint or a backend workflow, use the
Get rowsaction, which has its ownGroupingoption. Learn more about Get rows →
Summaries
Summaries calculate a value for a column, such as a total or an average. They use every record that matches the view's filters, not just the ones visible on screen.
To add a summary, click the cell under a column header (it shows — when the column has no summary yet), then pick a calculation. You can also use Summarize this field in the ⋮ menu of the column.
The calculations you can pick depend on the column type:
- Numbers:
Sum,Average,Minimum,Maximum,Range,Median,Standard deviation. - Dates:
Earliest,Latest,Date range. - Most columns:
Count non-empty,Count empty,Count unique,Percent empty,Percent filled,Percent unique.
You can pick several calculations for the same column, for example the sum and the average of amount. Each one shows a check mark in the menu. Click it again to remove it, or use Remove all summaries at the bottom of the menu.
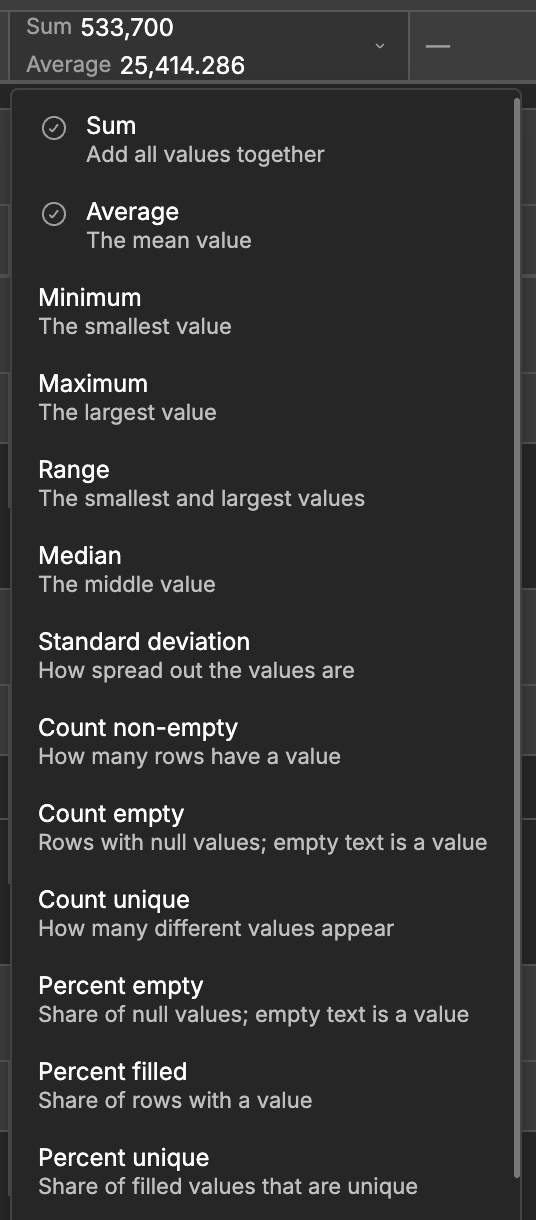
In a grouped view, each group shows its own results, and the Overall line at the top shows the results for the whole view. Summaries also work on views that are not grouped.
Count empty and Percent empty only count records with no value. A text that is empty still counts as a value.
Loading grouped results
A grouped view does not load everything at once. In the editor:
- Use
Load moreat the bottom of a group to see more of its records. - More groups load automatically as you scroll down the table.
- Closing a group only hides it. Its records are not changed.
In your app, the first time the view is retrieved, it returns the first 10 groups of the last level with up to 30 records each. To show more, use the Table View: Load more action. Learn how to load more in your app →
Parameters
Parameters allow you to pass dynamic values into your views, allowing you to then pass these values onto your filters and sorting to make them truly dynamic.
To create parameters, click the Parameters button above the table.
To add a parameter:
- Click
Add parameter - Enter the
Parameter name - Choose a
Parameter type:Text,Number, orBoolean - (Optional) Set a
Default valueformula - Click
Save
Using Parameters
To use a parameter in filters and sorting:
- Bind the value used for a filter or sort
- Set it to use the newly created parameter
Now, whenever you use the Table View: Fetch action in a workflow from the interface, you will be able to define what you wish to pass in for the values of the view's parameters.
Practical examples:
- Text search: create parameter
search(Text), then filter:name Contains searchordescription Contains search - Price filter: set parameter
minPrice(Number), then filter:price greater than minPrice
Securing your views
When you are creating a view, it is crucial that you ensure your users are only able to retrieve data that they are allowed to retrieve.
For example, an admin should be able to see all records, and a user should only be able to see records that belong to them.
There are multiple ways to secure your views depending on your requirements:
Securing based on authentication
If you wish to restrict access to a view simply depending on whether or not somone is signed in, then you can use the Access select.
Here you can easily restrict access to a view to only authenticated users (AKA users who are signed in)
Securing based on a specific role
Restricting a view to signed in users is often not enough. An admin dashboard, for example, should only return its records to the people who actually hold the admin role, not to every user who happens to be signed in.
To do this, open the Access select, keep it on Authenticated, then add the roles that are allowed to retrieve the data. The Match any control decides how those roles are combined, so a user needs to hold at least one of the roles you listed.
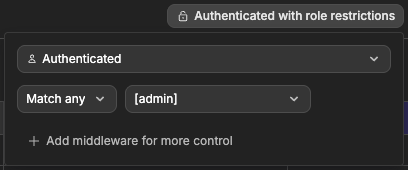
Once roles are in place, the label at the top of the popover changes to Authenticated with role restrictions, so you can confirm at a glance that the view is not left open to every signed in user.
Learn more about managing roles →
Securing with middleware
Some rules cannot be expressed with roles alone. Whether a user owns the record they are asking for, belongs to the right team, or is on a plan that gives them access to this data are all questions a role cannot answer on its own.
For those cases, click Add middleware for more control in the same Access popover and pick the middleware you want to run. The middleware runs before the view returns anything, so the records only reach the user once your own logic has approved the request.
Middleware is reusable, so a rule you write once (for example checking that the current user belongs to the workspace they are asking about) can protect several views, API Endpoints, and event triggers at the same time.
Securing data to a specific user
To make it so that a user is only able to retrieve data that belongs to them, you need to:
- Create a column of type
User - Link the appropriate records to their given user
- Set up a filter to only get the records linked to the current user
This ensures the view only returns records that are linked to the user retrieving the data.
Relationships (linked rows)
Relationship columns let a view “reach into” linked tables. This is useful for:
- Filtering by fields on a linked record.
- Showing extra fields from the linked record (not just its ID).
Next to an enabled relationship, you’ll also see a gear icon. This opens the relationship Settings, where you can:
- Set a
Display name (alias)to rename the relationship in this view. - Choose a
Join type:Left: Keeps rows even when the linked record is empty.Inner: Removes rows where the linked record is empty.
Showing fields from a linked record (Columns panel)
In the view columns panel, relationship sections are typically grouped as:
References(Links from your table to another table)Referenced by(Tables that link back to your table)
To include data from a linked record, open the Columns panel and turn on the relationship using the toggle next to its name. Once it's enabled, the relationship expands and shows a Columns section where you can pick which fields from the linked table should be included in the view results (or select all).
Nested relationships
You can configure relationships multiple levels deep (for example Order → Customer → Company) and apply filters to fields at each level.
Formula columns
Formula columns calculate values from other columns in the same row. In a view, you can show, hide, filter, and sort them just like regular columns.
You can create a formula column from the view itself or from the table's root Data tab. Either way it belongs to the table, so every view of that table can then show it from its Columns panel.
Legacy Formula V1 columns must be upgraded before filtering or sorting by their values. For missing fields or failed calculations, see Formula errors. Publish the project after changing a formula to update views used by the published app.
Learn how to create and use formula columns →
Using a view in the interface
The flow of using a view in the interface is as follows:
- In a workflow, use a
Table View: Fetchaction to get the data of your desired view. If you have any parameters set up, you will be able to define what should be passed to those parameters. - When the
Table View: Fetchaction has run, you will then be able to access the data of the view from the binding menu. - With the data of the view now available, you can use it in the interface. Meaning, you could bind it to a repeating list of items to display the data.
Display a grouped view
A grouped view gives your interface a list of groups instead of a plain list of records:
- A view without grouping returns its records in
data. - A grouped view returns its groups in
groups.
Each group contains its label (the value shown as the group name), its count (how many records it holds), and its summaries. A group that has subgroups lists them in children. Only the groups of the last level contain the records themselves, in rows.
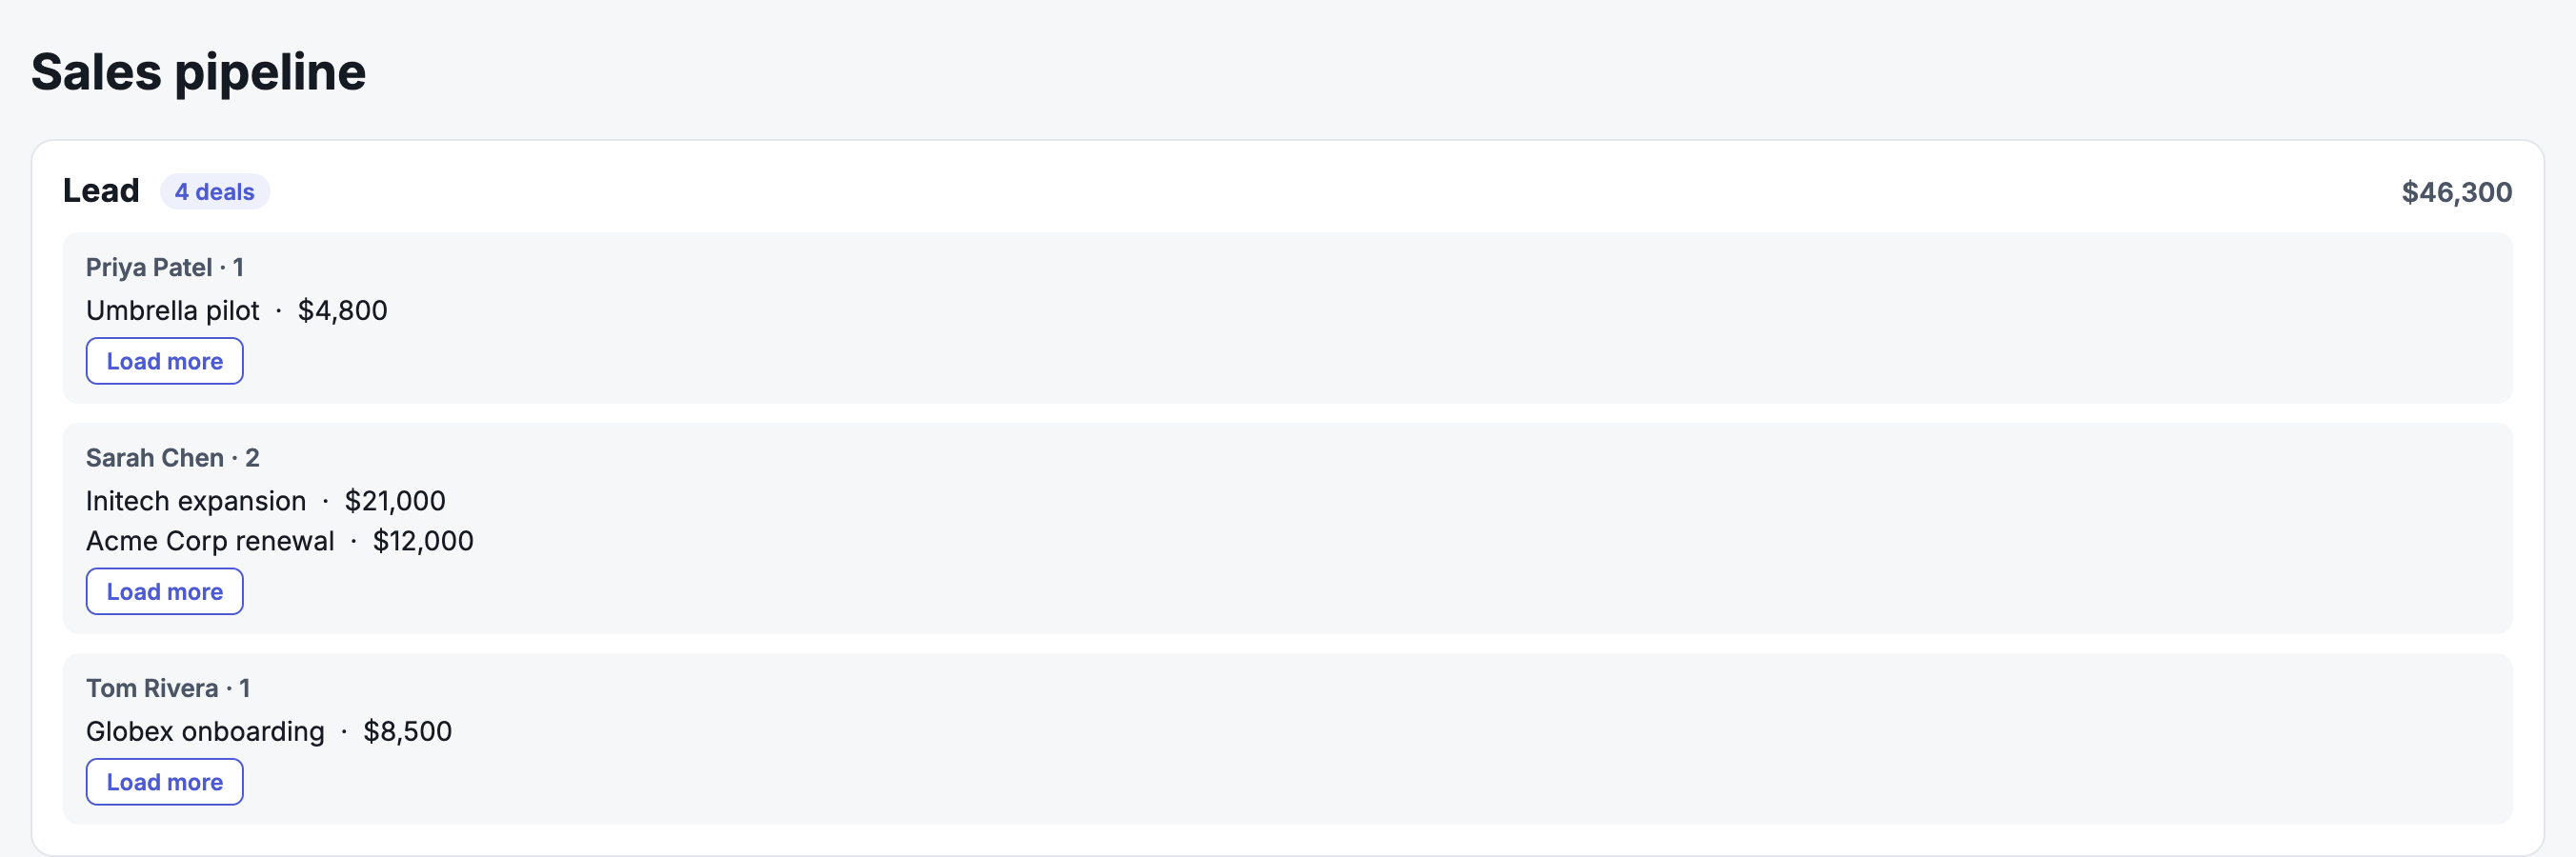
To show the deals pipeline below, grouped by stage and then by owner:
- Retrieve the view with a
Table View: Fetchaction, for example in a workflow that runs when the page loads. - Add a container for the stages, and bind its repeated items to the view's
groups. - Inside it, add a text bound to the group's
label, and another one bound to itscount. - Add a second container inside the first one for the owners, and bind its repeated items to the current group's
children. - Inside the owner container, add a third container for the deals, and bind its repeated items to the current group's
rows. Each item is now a record, so you can show itsnameandamount.
When you bind an element inside these containers, open the binding window and look under item.data: it shows every value of the current group.
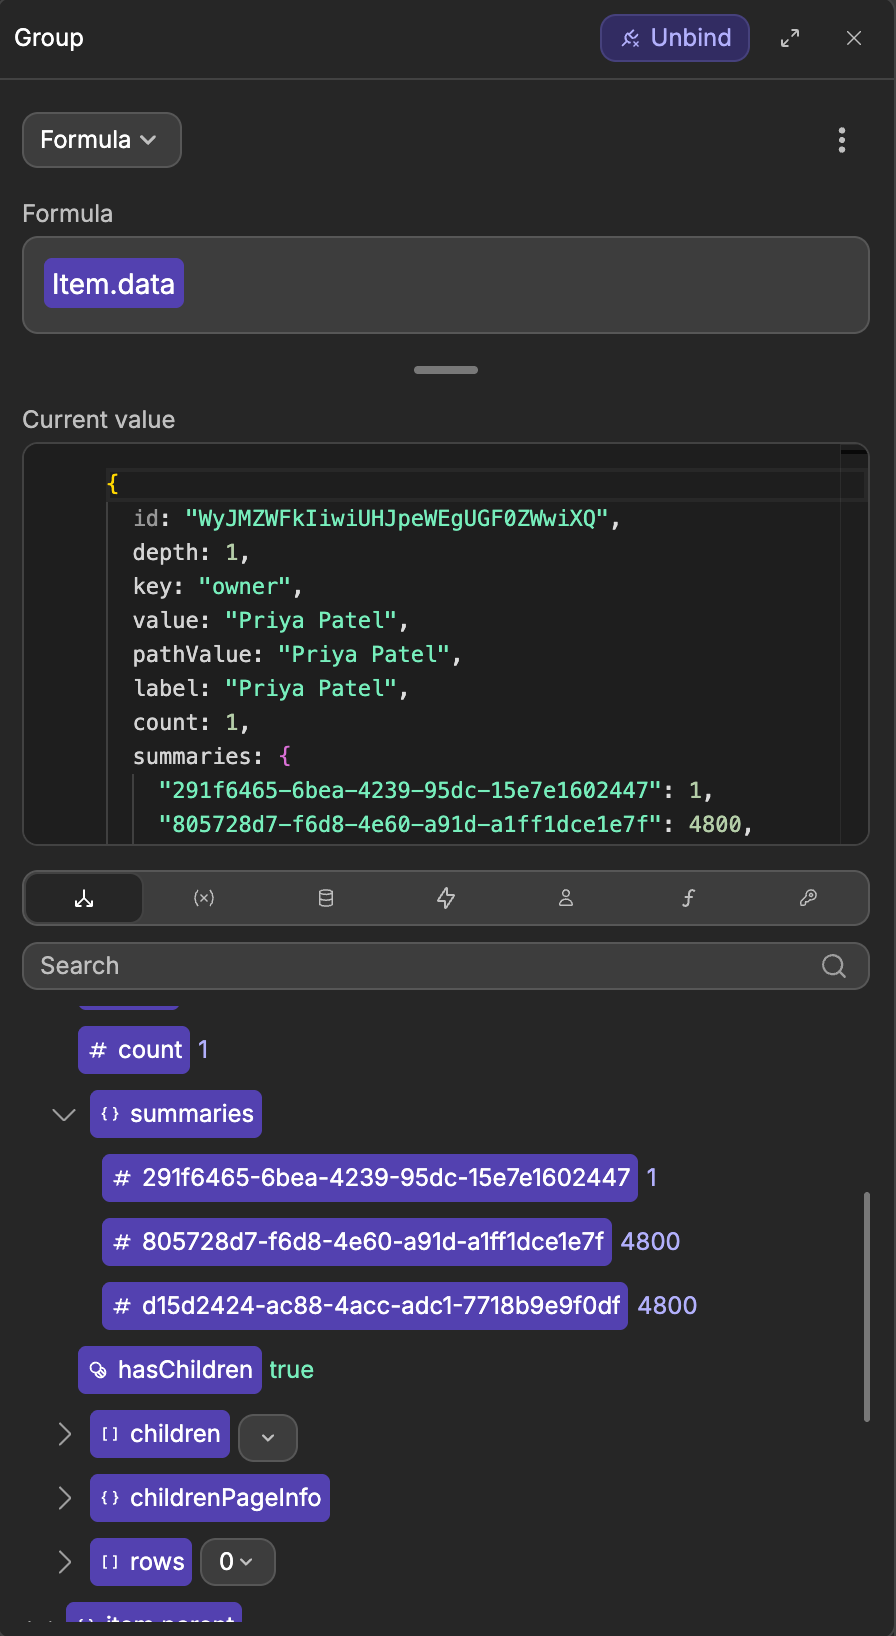
FINDING THE RIGHT SUMMARY
In the binding window, each summary is listed under a generated code (for example d15d2424-…) rather than its name. Use the value shown next to it to recognize the one you need. The results for the whole view are in the view's metadata, under summaries.
Load more records in a grouped view
To let users see more than the first records of a group, add a Load more button inside the group and give it a workflow with the Table View: Load more action:
- Select your view in
Table View. - Bind
Groupto the group the button belongs to (item.datawhen the button sits inside the repeated group).
What the action loads depends on the group you pass:
- A group of the last level: its next records.
- A group with subgroups: its next subgroups.
- No group: the next groups of the first level.
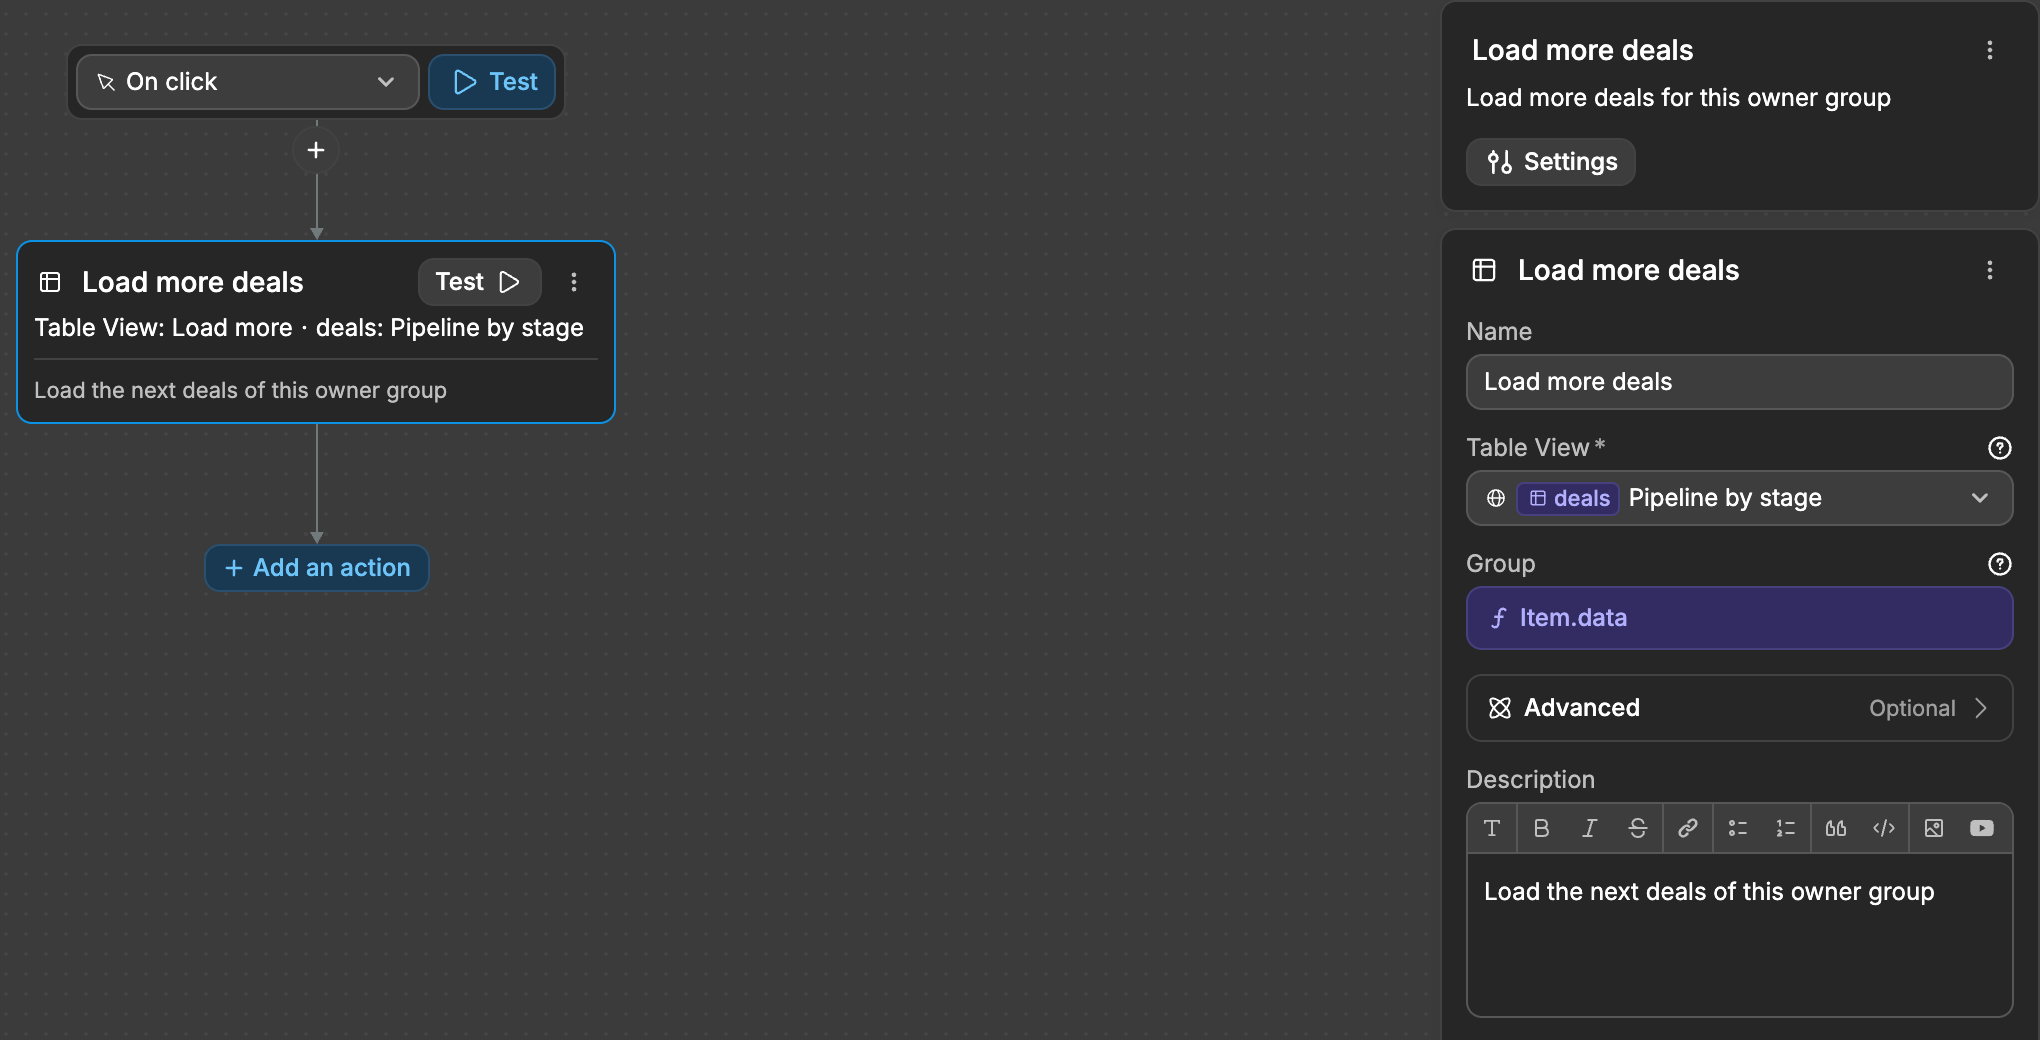
To hide the button once everything is loaded, bind its display to the group's childrenPageInfo.hasMore: it is true while there is more to load.
Continue learning
Once you have your tables created and are using views to appropriately display the data, the next core step will likely be setting up secure logic using backend workflows.