Appearance
Debugging the Editor
At times, you may experience issues with a project inside the WeWeb Editor. For example, a project won't open or will take time to load.
In most cases, this can be resolved with a little debugging on your side.
Here's a checklist that will help you debug your project:
Try opening the project in safe mode to check that the sluggishness is not coming from custom code in your project
Check that you are not loading too much data or asking the browser to render too many elements on the page
Restart your browser and computer to ensure both have enough available memory
1. Safe mode
If you are unable to open a project in the WeWeb Editor or if the project behaves unexpectedly, there's a good chance the issue is coming from a workflow, formula, or custom code in your project.
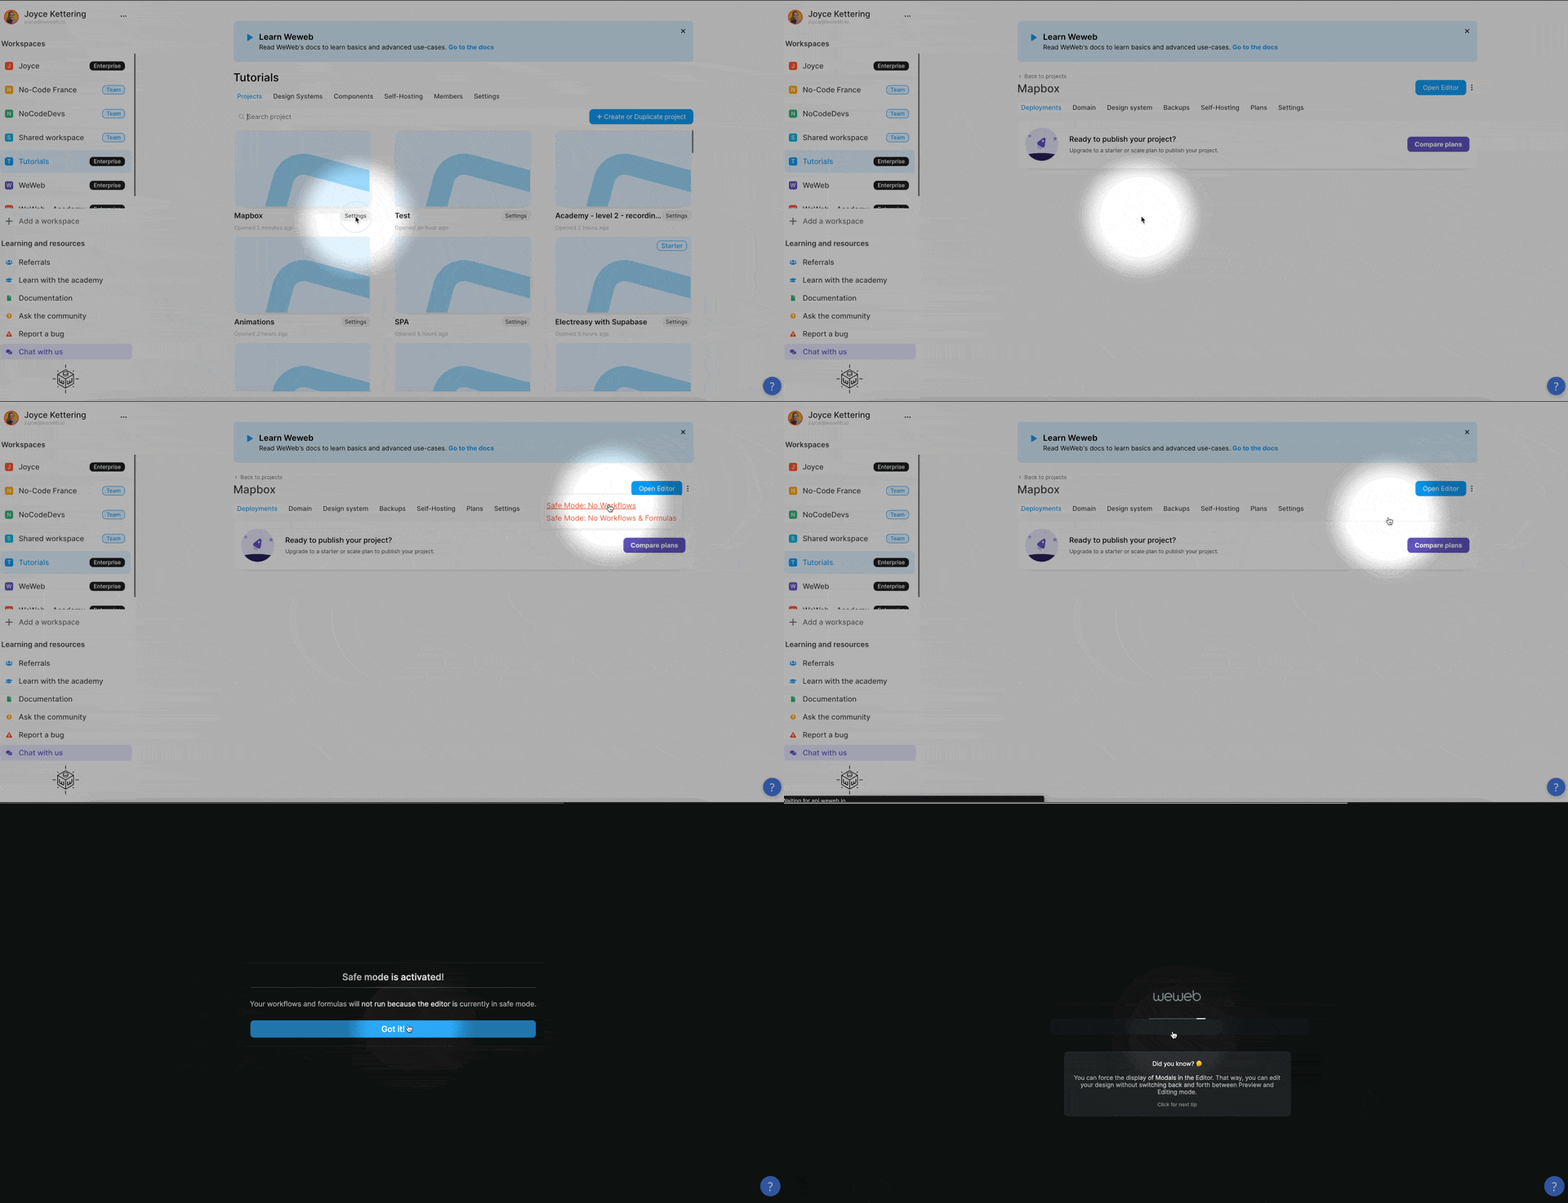
To debug this, we recommend opening the project in Safe Mode:

Once you're inside the project:
- Is there any custom code you can try removing?
- Are you triggering custom JavaScript in a workflow?
- Can you identify anything unexpected in your formulas?
Try removing potential conflicts one by one.
2. Volume of data
When you load too much data in a web browser, it will significantly slow down, maybe even crash.
This can be caused by:
- Collections that fetch too much information (heavy sets of data), and
- Pages with too many elements (too much rendering required from browser).
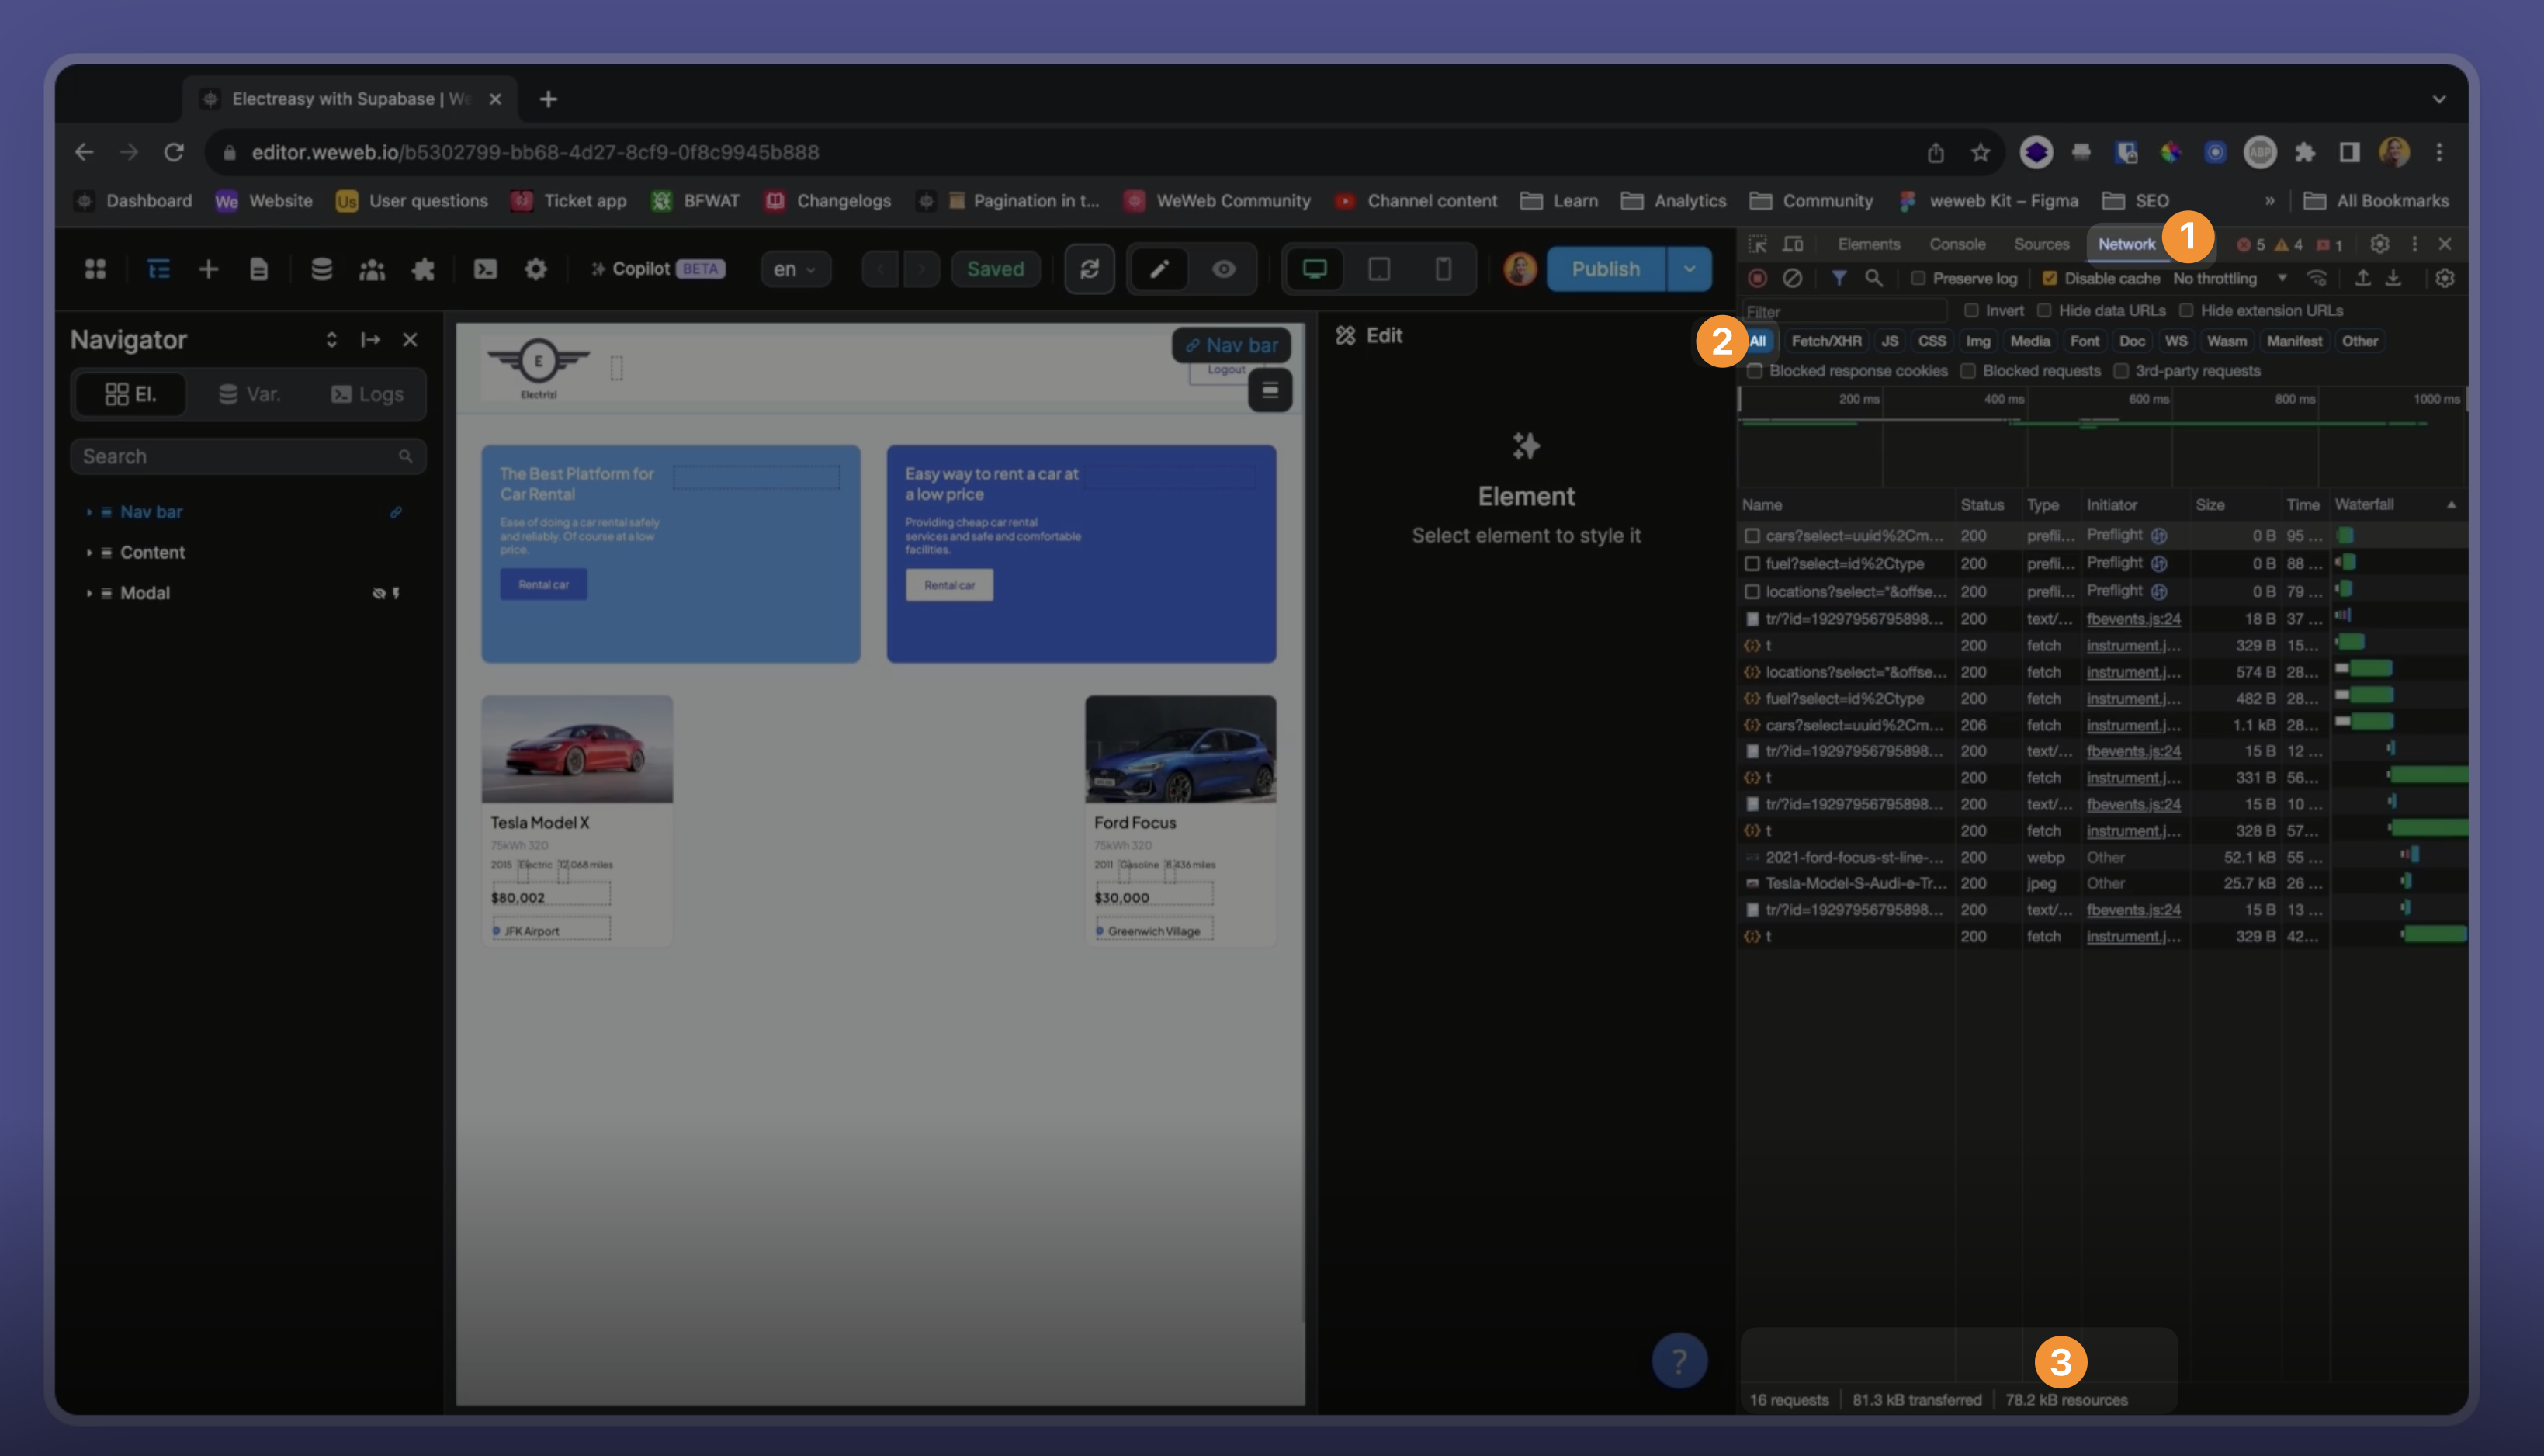
If you notice a project takes a long time to open, check that you don't have hundreds of elements on the homepage of the project, and consider opening the browser's inspector in the Network tab:

- How many requests are you making when you refresh the page?
- How long is each one taking?
- How much data are you fetching?
TIP
Web browsers slow down significantly and can even crash if you ask them to render hundreds of element on a page.
In order to improve the speed and responsiveness of your pages, we recommend you learn more about:
3. Code in data collections
If you have code inside a data collection (e.g. HTML code that you bind to a rich text element), that custom code is also processed by your browser.
Make sure to double check the validity of that custom code. Otherwise, there's a risk your browser and the browsers of your users will crash or behave unexpectedly.
4. Memory
When you keep tabs open for a long time in your browser, it can happen that the browser runs out of memory and starts slowing down.
When you don't turn off your computer for a very long time, it can happen that you run out of memory and things start getting slow.
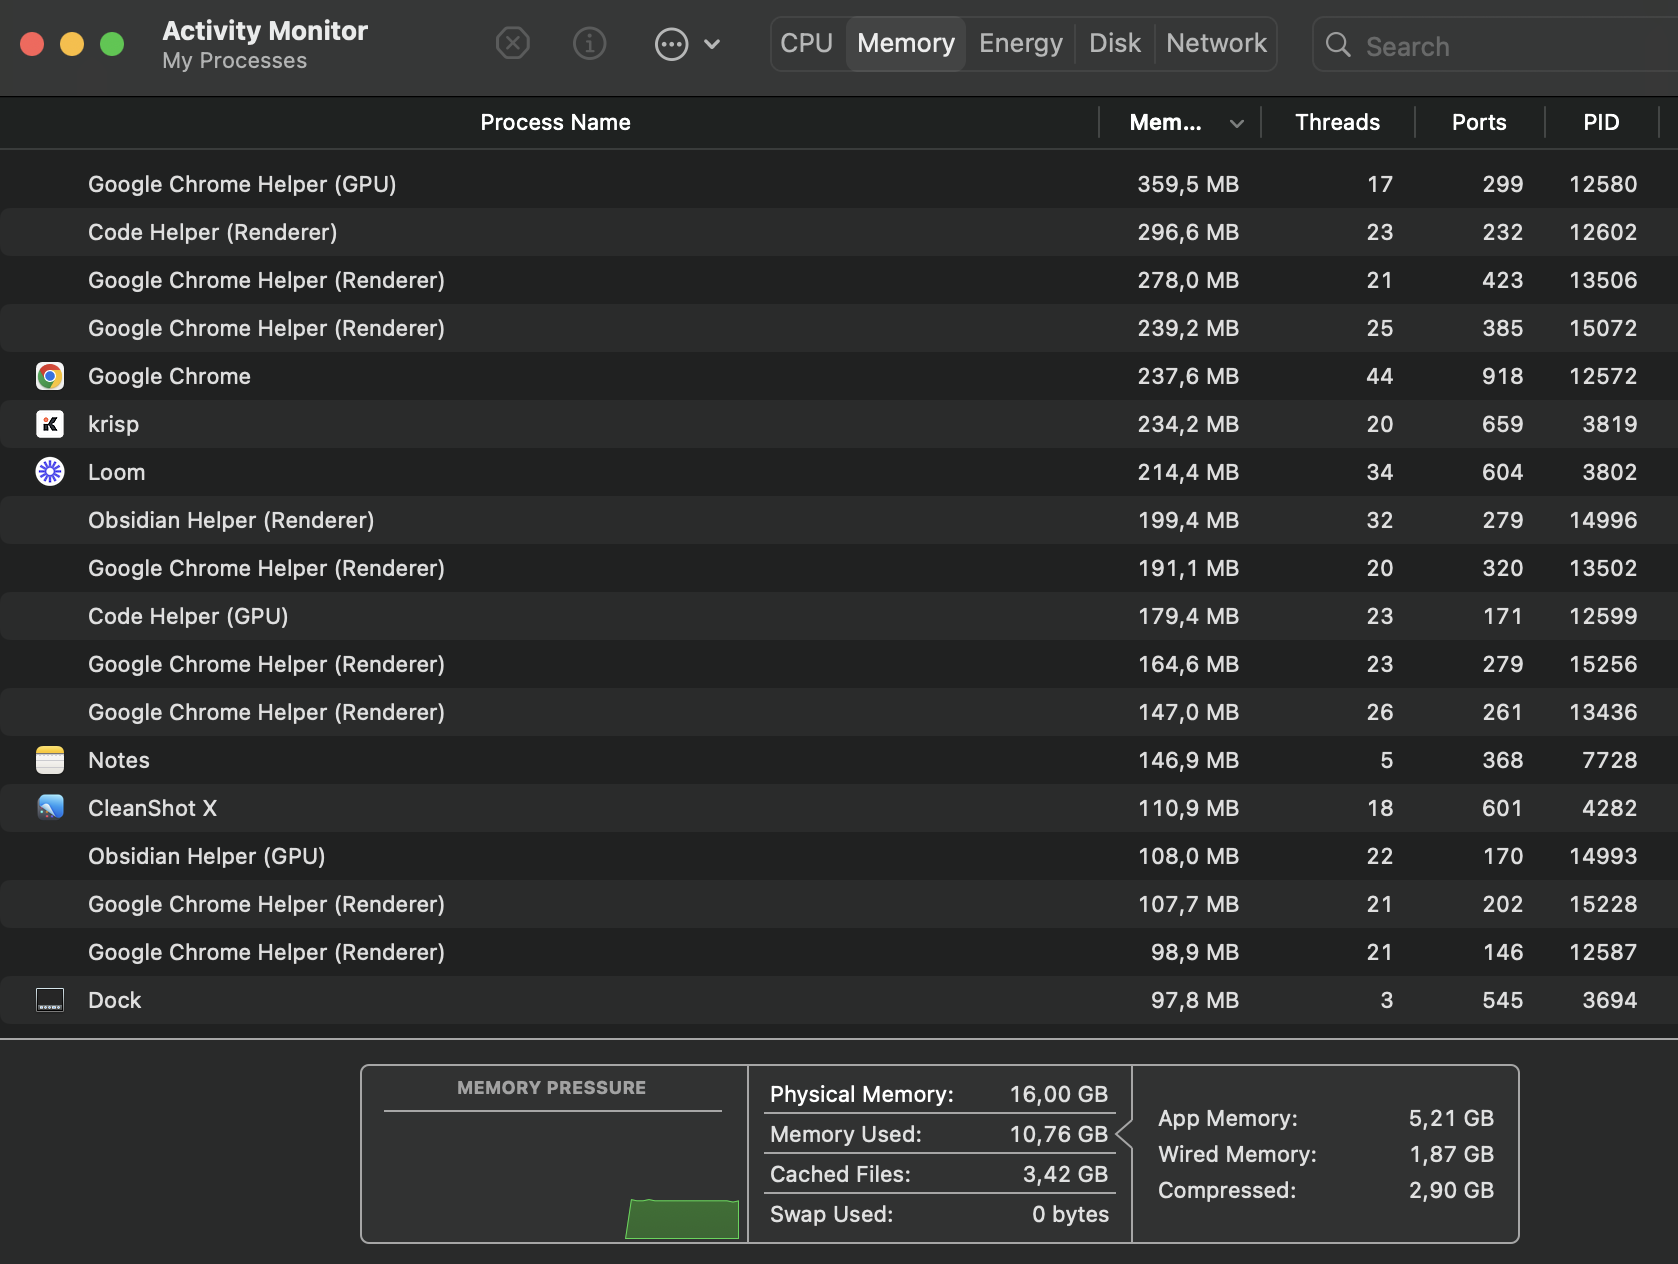
In the screenshot below, we are looking at our Mac Activity Monitor and can see that we are using 10.76GB of our 16GB physical memory:

Still slow?
To recap, if you are having issues opening a WeWeb project, we recommend that you:
Try opening the project in safe mode to check that the sluggishness is not coming from custom code in your project
Check that you are not loading too much data or asking the browser to render too many elements on the page
Restart your browser and computer to ensure both have enough available memory
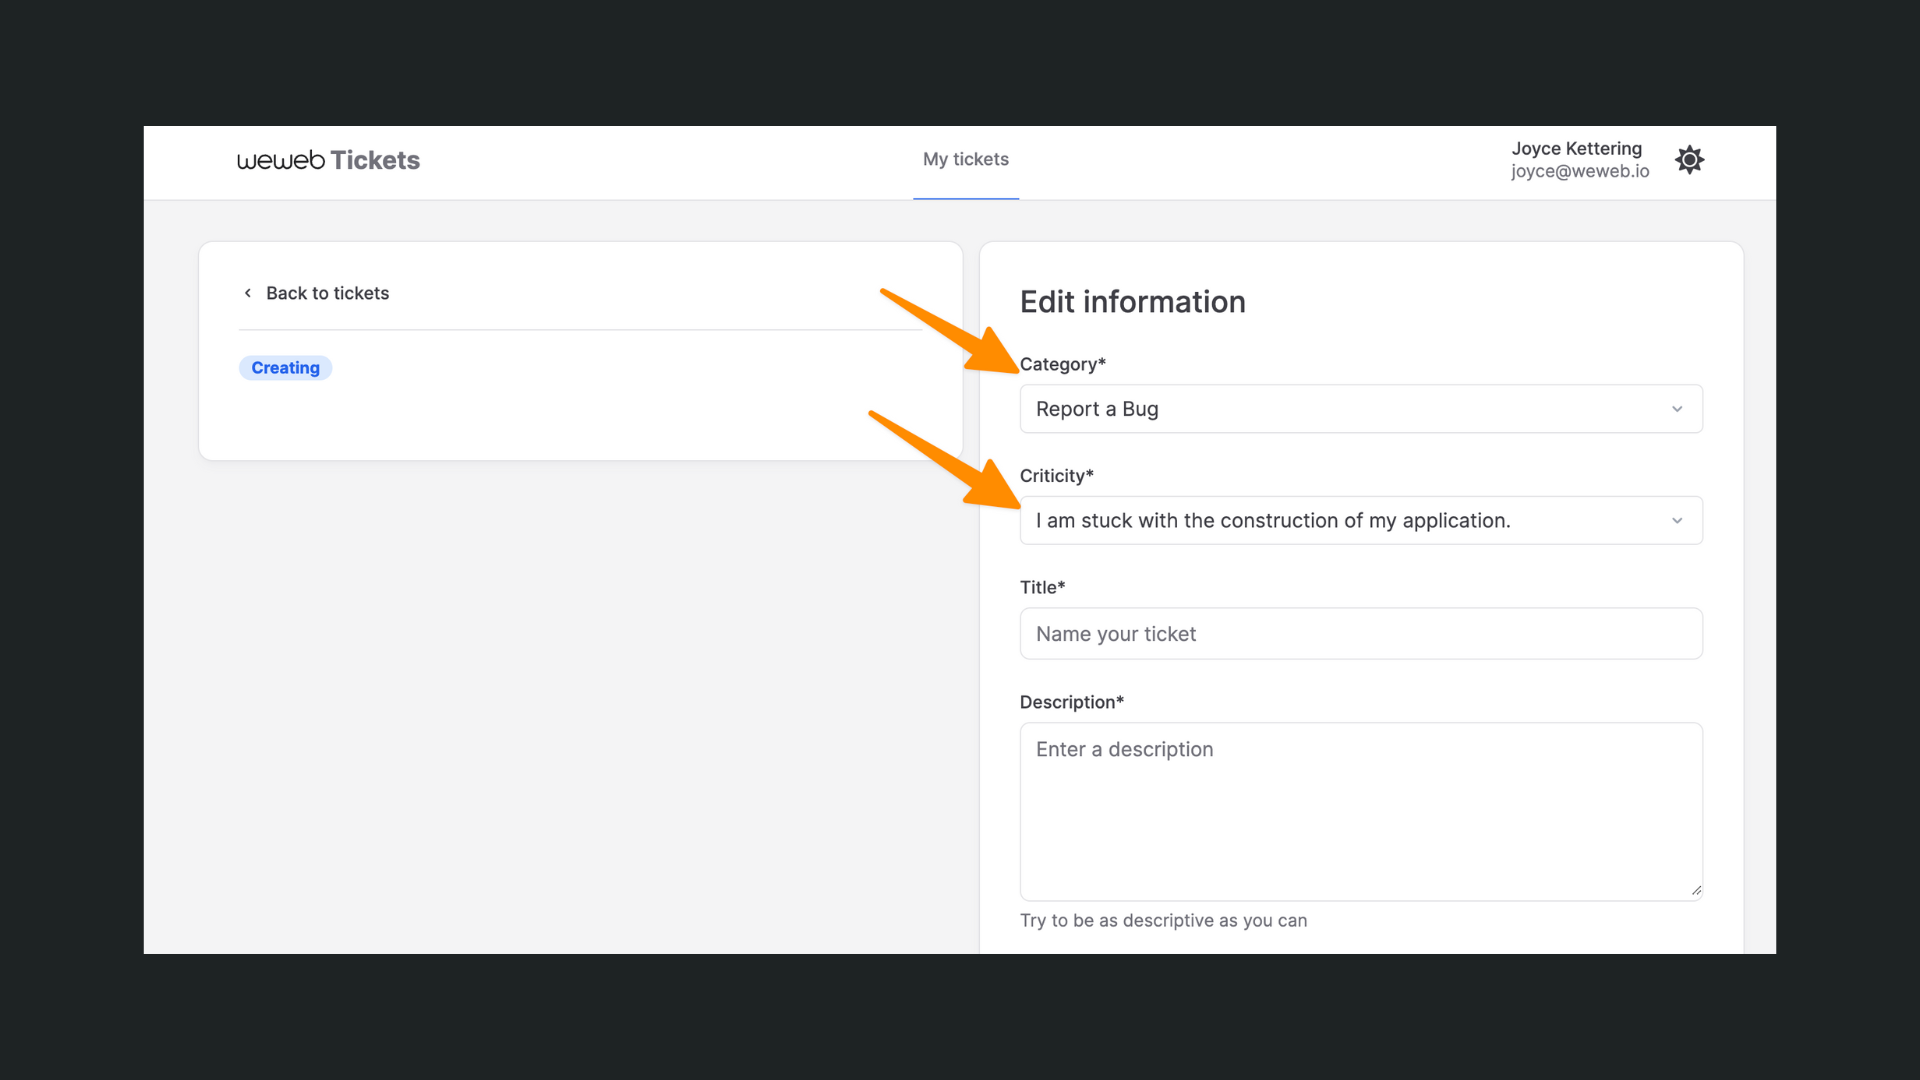
If you are still having issues opening a WeWeb project, please let us know asap in the support app:


